Never Ending Security

It starts all here

Category Archives: Digital Forensics

3 Websites For Vulnerability Research


After doing some research, we have created a small list of websites that will help you to perform vulnerability research. Here it is,

1. Security Tracker

 
Security Tracker provides daily updating huge database to the users. It is really simple to use and effective. Anyone can search the site for latest vulnerability information listed under various categories. Best tool for security researchers.

2. Hackerstorm

 
Hackerstorm provides a vulnerability database tool, which allows users to get almost all the information about a particular vulnerability. Hackerstorm provides daily updates for free but source is available for those who wish to contribute and enhance the tool. Such huge data is provided by http://www.osvdb.org and its contributors.

3. Hackerwatch

 
Hackerwatch is not a vulnerability database, but it is a useful tool for every security researcher. It is mainly an online community where internet users can report and share information to block and identify security threats and unwanted traffic.

Linux super-duper admin tools: lsof


lsof is one of the more important tools you can use on your Linux box. Its name is somewhat misleading. lsof stands for lisopen files, but the term files fails to impact the true significance of power. That is, unless you remember the fundamental lesson, in Linux everything is a file.

We have had several super-duper admin articles, focusing around tools that help us understand better the behavior of our system, try to identify performance bottlenecks and solve issues that do not have an apparent, immediate presence in the logs. Save for vague, indirect symptoms, you might be struggling to understand what is happening under the hood.

Teaser

lsof, alongside strace and OProfile, is another extremely versatile, powerful weapon in the arsenal of a system administrator and the curious engineer. Used correctly, it can yield a wealth of information about your machine, helping you narrow down the problem solving and maybe even expose the culprit.

So let’s see what this cool tool can do.

Why is lsof so important?

I did say lsof is important, but I did not say why. Well, the thing is, with lsof you can do pretty much anything. It encompasses the functionality of numerous other tools that you may be familiar with.

For example, lsof can provide the same information netstat offers. You can use lsof to find mounts on your machine, so it supplements both /etc/mtab and /proc/mounts. You can use lsof to learn what open files a processes holds. In general, pretty much anything you can find under the /proc filesystem, lsof can display in a very simple, centric manner, without writing custom scripts for looping through the sub-directories and parsing and filtering content.

lsof allows you to display information for particular users, processes, show only traffic for certain network protocols, file handles, and more. Used effectively, it’s the Swiss Knife of admin utilities.

lsof in action

A few demonstrations are in order.

Run without any parameters, lsof will display all of the information for all of the files. At this point, I should reiterate the fact there are many types of files. While most uses treat their music and Office documents as files, the generic description goes beyond that. Devices, sockets, pipes, and directories are also files.

lsof output explained

Before we dig in, let’s take a look at a basic output:

Basic usage

Command is the name of the process. It also includes kernel threads. PID is the process ID. USER is the owner of the process. FD is the first truly interesting field.

The FD stands for File Descriptor, an abstract indicator for accessing of files. File descriptors are indexes in kernel data structures called file descriptor tables, which contain details of all open files. Each process has its file descriptor table. User applications that wish to read and write to files will instead read to and write from file descriptors using system calls. The exact type of the file descriptor will determine what the read and write operations really mean.

In our example, we have several different values of FD listed. If you have ever looked under the /proc filesystem and examined the structure of a process, some of the entries will be familiar. For instance, cwdstands for Current Working Directory of the listed process. txt is the Text Segment or the Code Segment (CS), the bit of the object containing executable instructions, or program code if you will. mem stands for Data Segments and Shared Objects loaded into the memory. 10u refers to file descriptor 10, open for both reading and writing. rtd stands for root directory.

As you can see, you need to understand the output, but once you get the hang of it, it’s a blast. lsof provides a wealth of information, formatted for good looks, without too much effort. Now, it’s up to you to put the information to good use.

The fifth column, TYPE is directly linked to the FD column. It tells us what type of file we’re working with. DIR stands for directory. REG is a regular file or a page in memory. FIFO is a named pipe. Symbolic links, sockets and device files (block and character) are also file types. unknown means that the FD descriptor is of unknown type and locked. You will encounter these only with kernel threads.

For more details, please read the super-extensive man page.

Now, we’re already having a much better picture of what lsof tells us. For instance, 10u is a pipe used by initctl, a process control initialization utility that facilitates the startup of services during bootup. All in all, it may not mean anything at the moment, but if and when you have a problem, the information will prove useful.

The DEVICE column tells us what device we’re working on. The two numbers are called major and minor numbers. The list is well known and documented. For instance, major number 8 stands for SCSI block device. For comparison, IDE disks have a major number 3. The minor number indicates one of the 15 available partitions. Thus (8,1) tell us we’re working on sda1.

(0,16), the other interesting device listed refers to unnamed, non-device mounts.

For detailed list, please see:

http://www.kernel.org/pub/linux/docs/device-list/devices.txt

SIZE/OFF is the file size. NODE is the Inode number. Name is the name of the file. Again, do not be confused. Everything is a file. Even your computer monitor, only it has a slightly different representation in the kernel.

Now, we know everything. OK, unfiltered output is too much to digest in one go. So let’s start using some flags for smart filtering of information.

Per process

To see all the open files a certain process holds, use -p:

lsof -p <pid>

lsof -p

Per user

Similarly, you can see files per user using the -u flag:

lsof -u <name>

lsof -u

File descriptors

You can see all the processes holding a certain fie descriptor with -d <number>:

lsof -d <number>

lsof -d 3

This is very important if you have hung NFS mounts or blocked processes in uninterruptible sleep (D state) refusing to go away. Your only way to start solving the problem is do dig into lsof and trace down the dependencies, hopefully finding processes and files that can be killed and closed. Alternatively, you can also display all the open file descriptors:

Rising number

Notice that the number is rising in sequence. In general, Linux kernel will give the first available file descriptor to a process asking for one. The convention calls for file descriptors 0, 1 and 2 to be standard input (STDIN), standard output (STDOUT) and standard error (STDERR), so normally, file descriptor allocation will start from 3.

If you’ve ever wondered what we were doing when we devnull-ed both the standard output and the standard error in the strace examples, this ought to explain it. We had the following:

something > /dev/null 2>&1

In other words, we redirected standard output to /dev/null, and then we redirected file descriptor 2 to 1, which means standard error goes to standard output, which itself is redirected to the system black hole.

Finding file descriptors can be quite useful, especially if some applications are hard-coding their use, which can lead to problems and conflicts. But that’s a different story altogether.

One more thing notable from the above screenshot are the unix and CHR FD types, which we have not yet seen. unix stands for UNIX domain socket, an interprocess communication socket, similar to Internet sockets, only without using a network protocol. CHR stands for a character device. Character devices allow the transmission of a single bit of data; typical examples are terminals, keyboard, mouse, and similar peripherals, where the order of data is critical.

Do not confuse domain sockets with classic sockets, which is an end-point consisting of an IP address and a port.

Netstat-like behavior

lsof can also provide lots of information similar and identical to netstat. You can dump the listing of all files and then grep for relevant information, like LISTEN, ESTABLISHED, IPV4, or any other network related term.

netstat

Internet protocols & ports

Specifically, lsof can also show you the open ports for either IPv4 or IPv6 protocols, much like nmap scan against the localhost:

lsof -i<protocol>

lsof -i

Directory search

lsof also supports a number of flags that are enabled with + and disabled with – signs, rather than the typical use of single or double dash (-) characters as option separators.

One of these is +d (and +D), which lets you show all the processes holding a certain directory. The capital D also lets you recurse and expands all the files in the directory and its sub-directories, whereas lower d will just show the directories and no files.

lsof +d <dir name> or lsof +D <dirname>

Dir search

Practical example

I’ve given you two juicy examples when I wrote the strace tutorial. I skimped a bit with OProfile, because finding simple and relevant problems that can be quickly demonstrated with a profiler tool are not easy to come by – but do not despair, there shall be an article.

Now, lsof allows a plenty of demo space. So here’s one.

How do you handle a stuck mount?

Let’s say you have a mount that refuses to go down. And you don’t really know what’s wrong. For some reason, it won’t let you unmount it.

df

/proc/mounts

You tried the umount command, but it does not really work:

Busy

Luckily for you, openSUSE recommends using lsof, but let’s ignore that for a moment.

Anyhow, your mount won’t come down. In desperation and against better judgment, you also try forcing the unmounting of the mount point with -f flag, but it still does not help. Not only the mount is refusing to let go, you may have also corrupted the /etc/mtab file by issuing the force mount command. Just some food for thought.

Now, how do you handle this?

The hard way

If you’re experienced and know your way about /proc, then you can do the following:

Under /proc, examine the current working directories and file descriptors holding the mount point. Then, examine the process table and see what the offending processes are and if they can be killed.

ls -l /proc/*/cwd | grep just

cwd

Furthermore:

ls -l /proc/*/fd | grep just

fd

Finally, in our example:

ps -ef | grep -E ‘10878|10910’

ps

And problem solved …

Note: sometimes, especially if you have problems with mounts or stuck processes, lsof may not be the best tool, as it too may get stuck trying to recurse. In these delicate cases, you may want to use the -n and -l flags. -n inhibits the conversion of network IP addresses to domain names, making lsof work faster and avoids lockups due to name lookup not working properly. -l inhibits conversion of user IDs to names, quite useful if name lookup is working slowly or improperly, including problems with nscd daemon, connectivity to NIS, LDAP or whatever, and other issues. However, sometimes, in extreme cases, going for /proc may be the most sensible option.

The easy (and proper) way

By the book, using lsof ought to do it:

lsof | grep just

lsof just

And problem solved. Well, we still need to free the mount by closing or killing the process and the files held under the mount point, but we know what to do. Not only do we get all the information we need, we do this quickly, efficiently.

Knowing the alternative methods is great, but you should always start smart and simple, with lsof, exploring, narrowing down possibilities and converging on the root cause.

I hope you liked it.

Conclusion

There you go,a wealth of information about lsof and what it can do for you. I bet you won’t easily find detailed explanation about lsof output elsewhere, although examples about the actual usage are aplenty. Well, my tutorial provides you with both.

Now, the big stuff is ahead of you. Using lsof to troubleshoot serious system problems, without wasting time going through /proc and trying to find relevant system information, when it’s all there, hidden under just one mighty command.

Linux hacks you probably did not know about


This article is a compilation of several interesting, unique command-line tricks that should help you squeeze more juice out of your system, improve your situational awareness of what goes on behind the curtains of the desktop, plus some rather unorthodox solutions that will melt the proverbial socks off your kernel.

Follow me for a round of creative administrative hacking.

1. Run top in batch mode

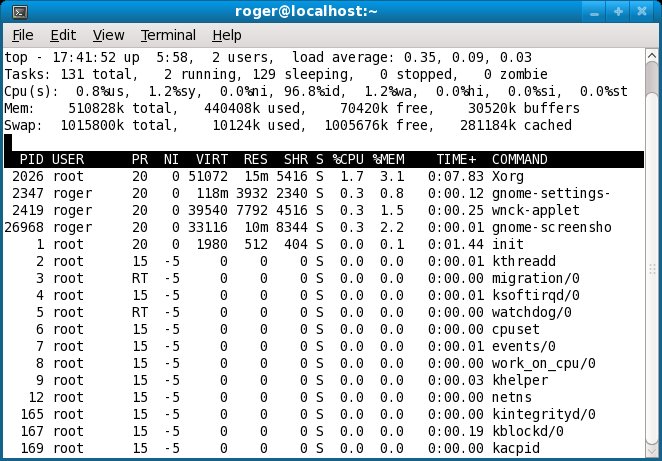
top is a handy utility for monitoring the utilization of your system. It is invoked from the command line and it works by displaying lots of useful information, including CPU and memory usage, the number of running processes, load, the top resource hitters, and other useful bits. By default, top refreshes its report every 3 seconds.

Top

Most of us use top in this fashion; we run it inside the terminal, look on the statistics for a few seconds and then graciously quit and continue our work.

But what if you wanted to monitor the usage of your system resources unattended? In other words, let some system administration utility run and collect system information and write it to a log file every once in a while. Better yet, what if you wanted to run such a utility only for a given period of time, again without any user interaction?

There are many possible answers:

  • You could schedule a job via cron.
  • You could run a shell script that runs ps every X seconds or so in a loop, incrementing a counter until the desired number of interactions elapsed. But you would also need uptime to check the load and several other commands to monitor disk utilization and what not.

Instead of going wild about trying to patch a script, there’s a much, much simpler solution: top in batch mode.

top can be run non-interactively, in batch mode. Time delay and the number of iterations can be configured, giving you the ability to dictate the data collection as you see fit. Here’s an example:

top -b -d 10 -n 3 >> top-file

We have top running in batch mode (-b). It’s going to refresh every 10 seconds, as specified by the delay (-d) flag, for a total count of 3 iterations (-n). The output will be sent to a file. A few screenshots:

Batch mode 1

Batch mode 2

And that does the trick. Speaking of writing to files …

2. Write to more than one file at once with tee

In general, with static data, this is not a problem. You simply repeat the write operation. With dynamic data, again, this is not that much of a problem. You capture the output into a temporary variable and then write it to a number of files. But there’s an easier and faster way of doing it, without redirection and repetitive write operations. The answer: tee.

tee is a very useful utility that duplicates pipe content. Now, what makes tee really useful is that it can append data to existing files, making it ideal for writing periodic log information to multiple files at once.

Here’s a great example:

ps | tee file1 file2 file3

That’s it! We’re sending the output of the ps command to three different files! Or as many as we want. As you can see in the screenshots below, all three files were created at the same time and they all contain the same data. This is extremely useful for constantly changing output, which you must preserve in multiple instances without typing the same commands over and over like a keyboard-loving monkey.

tee 1

tee 2

tee 3

Now, if you wanted to append data to files, that is periodically update them, you would use the -a flag, like this:

ps | tee -a file1 file2 file3 file4

3. Unleash the accounting power with pacct

Did you know that you can log the completion of every single process running on your machine? You may even want to do this, for security, statistical purposes, load optimization, or any other administrative reason you may think of. By default, process accounting (pacct) may not be activated on your machine. You might have to start it:

/usr/sbin/accton /var/account/pacct

Once this is done, every single process will be logged. You can find the logs under /var/account. The log itself is in binary form, so you will have to use a dumping utility to convert it to human-readable form. To this end, you use the dump-acct utility.

dump-acct pacct

The output may be very long, depending on the activity on your machine and whether you rotate the logs, which you should, since the accounting logs can inflate very quickly.

dump-acct

And there you go, the list of all processes ran on our host since the moment we activated the accounting. The output is printed in nice columns and includes the following, from left to right: process name, user time, system time, effective time, UID, GID, memory, and date. Other ways of starting accounting may be in the following forms:

/etc/init.d/psacct start

Or:

/etc/init.d/acct start

In fact, starting accounting using the init script is the preferred way of doing things. However, you should note that accounting is not a service in the typical form. The init script does not look for a running process – it merely checks for the lock file under /var. Therefore, if you turn the accounting on/off using the accton command, the init scripts won’t be aware of this and may report false results.

BTW, turning accounting off with accton is done just like that:

/usr/sbin/accton

When no file is specified, the accounting is turned off. When the command is run against a file, as we’ve demonstrated earlier, the accounting process is started. You should be careful when activating/deactivating the accounting and stick to one method of management, either via the accton command or using the init scripts.

4. Dump utmp and wtmp logs

Like pacct, you can also dump the contents of the utmp and wtmp files. Both these files provide login records for the host. This information may be critical, especially if applications rely on the proper output of these files to function.

Being able to analyze the records gives you the power to examine your systems in and out. Furthermore, it may help you diagnose problems with logins, for example, via VNC or ssh, non-console and console login attempts, and more.

You can dump the logs using the dump-utmp utility. There is no dump-wtmp utility; the former works for both.

Dump utmp

You can also do the following:

dump-utmp /var/log/wtmp

Here’s what the sample file looks like:

utmp log

5. Monitor CPU and disk usage with iostat

Would you like to know how your hard disks behave? Or how well does your CPU churn? iostat is a utility that reports statistics for CPU and I/O devices on your system. It can help you identify bottlenecks and mis-tuned kernel parameters, allowing you to boost the performance of your machine.

On some systems, the utility will be installed by default. Ubuntu 9.04, for example, requires that you installsysstat package, which, by the way, contains several more goodies that we will soon review:

Install sysstat

Then, we can start monitoring the performance. I will not go into details what each little bit of displayed information means, but I will focus on one item: the first output reported by the utility is the average statistics since the last reboot.

Here’s a sample run of iostat:

iostat -x 10 10

The utility runs 10 times, every 10 seconds, reporting extended (-x) statistics. Here’s what the sample output to terminal looks like:

iostat example

6. Monitor memory usage with vmstat

vmstat does the similar job, except it works with the virtual memory statistics. For Windows users, please note the term virtual does not refer to the pagefile, i.e. swap. It refers to the logical abstraction of memory in kernel, which is then translated into physical addresses.

vmstat reports information about processes, memory, paging, block IO, traps, and CPU activity. Again, it is very handy for detecting problems with system performance. Here’s a sample run of vmstat:

vmstat -x 10 10

The utility runs 10 times, reporting every 1 second. For example, we can see that out system has taken some swap, but it’s not doing anything much with it, there’s approx. 35MB free memory and there’s very little I/O activity, as there are no blocked processes. The CPU utilization spikes from just a few percents to almost 90% before calming down.

Nothing specially exciting, but in critical situations, this kind of information can be critical.

vmstat example

7. Combine the power of iostat and vmstat with dstat

dstat aims to replace vmstat, iostat and ifstat combined. It also offers exporting data into .csv files that can then be analyzed using spreadsheet software. dstat uses a pleasant color output in the terminal:

Terminal

Plus you can make really nice graphs. The spike in the graph comes from opening the Firefox browser, for instance.

CSV

Graph

8. Collect, report or save system activity information with sar

sar is another powerful, versatile system. It is a sort of a jack o’ all trades when it comes to monitoring and logging system activity. sar can be very useful for trying to analyze strange system problems where normal logs like boot.msg, messages or secure under /var/log do not yield too much information. sar writes the daily statistics into log files under /var/log/sa. Like we did before, we can monitor CPU utilization, every 2 seconds, 10 times:

sar -u 2 10

CPU example

Or you may want to monitor disk activity (10 iterations, every 5 seconds):

sar -d 5 10

Disk example

Now for some really cool stuff …

9. Create UDP server-client – version 1

Here’s something radical: create a small UDP server that listens on a port. Then configure a client to send information to the server. All this without root access!

Configure server with netcat

netcat is an incredibly powerful utility that can do just about anything with TCP or UDP connections. It can open connections, listen on ports, scan ports, and much more, all this with both IPv4 and IPv6.

In our example, we will use it to create a small UDP server on one of the non-service ports. This means we won’t need root access to get it going.

netcat -l -u -p 42000

Here’s what we did:

-l tells netcat to listen, -u tells it to use UDP, -p specifies the port (42000).

Netcat idle

We can indeed verify with netstat:

netstat -tulpen | grep 42000

And we have an open port:

netstat

Configure client

Now we need to configure the client. The big question is how to tell our process to send data to a remote machine, to a UDP port? The answer is quite simple: open a file descriptor that points to the remote server. Here’s the actual BASH script that we will use to test our connection:

Client script

The most interesting bit is the line that starts with exec.

exec 104<> /dev/udp/192.168.1.143/$1

We created a file descriptor 104 that points to our server. Now, it is possible that the file descriptor number 104 might already be in use, so you may want to check first with lsof or randomize the choice of the descriptor. Furthermore, if you have a name resolution mechanism in place, you can use a hostname instead of an IP. If you wanted to use a TCP connection, you would use /dev/tcp.

The choice of the port is defined by the $1 variable, passed as a command-line argument. You can hard code it – or make everything configurable by the user at runtime. The rest of the code is unimportant; we do something and then send information to our file descriptor, without really caring what it is. Again, we need no root access to do this.

Test connection

Now, we can see the server-client connection in action. Our server is a Ubuntu 8.10 machine, while our client is a Fedora 11. We ran the script on the client:

Script running

And watch the command-line on the server:

Server working

To make it even more exciting, I’ve created a small Flash demo with Wink. You are welcome to play the file, if you’re interested:

Cool, eh?

10. Configure UDP server-client – version 2

The limitation with the exercise above is that we do not control over some of the finer aspects of our connection. Furthermore, the connection is limited to a single end-point. If one client connects, others will be refused. To make things more exciting, we can improve our server. Instead of using netcat, we will write one of our own – in Perl.

Perl is a powerful programming language, very flexible, very neat. I must admin I have only recently began dabbling in it, so do not expect any miracles, but here’s one way of creating a UDP server in Perl – there are tons of other implementations available, better, smarter, faster, and more elegant.

The code is very simple. First, let’s take a look at the entire file and then examine sections of code. Here it is:

#!/usr/bin/perl

use IO::Socket;

$server = IO::Socket::INET->new(LocalPort => ‘50060’,
Proto => “udp”)
or die “Could not create UDP server on port
$server_port : $@n”;

my $datagram;
my $MAXSIZE = 16384; #buffer size

while (my $data=$server->recv($datagram,$MAXSIZE))
{
print $datagram;

my $logdate=`date +”%m-%d-%H:%M:%S”`;
chomp($logdate);

my $filename=”file.$logdate”;
open(FD,”>”,”$filename”);
print FD $datagram;
close(FD);
}

close($server);

The code begins with the standard Perl declaration. If you want extra debugging, you can add the -w flag. If you want to use strict code, then you may also want to add use strict; declaration. I warmly recommend this.

The next important bit is this one:

use IO::Socket;

This one tells Perl to use the IO::Socket object interface. You can also use IO:Socket::INET specifically for domain sockets. For more information, please check the official Perl documentation.

The next bit is the creation of the socket, i.e. server:

$server = IO::Socket::INET->new(LocalPort => ‘50060’,
Proto => “udp”)
or die “Could not create UDP server on port
$server_port : $@n”;

We are trying to open the local UDP port 50060. If this cannot be done, the script will die with a rather descriptive message.

Next, we define a variable that will take incoming data (datagram) and the buffer size. The buffer size might be limited by the network implementation or network restrictions on your router/switch or the kernel itself, so some values might not work for you.

And then, we have the server doing some hard work. It prints the data to the screen. But it also creates a log file with a time stamp and prints the data to the file as well.

The beauty of this implementation is that the server permits multiple incoming connections. Of course, you will have to decide how you want to differentiate the data sent by different clients, whether by a message header or using additional IO:Socket:INET objects like PeerAddr.

On the client side, nothing changes.

Conclusion

That’s it for now. This crazy collection should help you impress your boyfriends and girlfriends, evoke a smile with your peers or even your boss and help you be more detailed and productive when it comes to system administration tasks. Some of the utilities and tricks presented here are tremendously useful.

If you’re wondering what distribution you may need to be running to get these things done, don’t worry. You can get them working on all distros. Throughout this document, I demonstrated using Ubuntu 8.10, Ubuntu 9.04 and Fedora 11. Debian-based or RedHat-based, there’s something for everyone.

In the next article, we will also talk about other crazy hacks and tips, including a very, very useful utility calledsec – Simple Event Correlator. That’s just a brain teaser for now. I hope you enjoyed this article. See you around.


Hello there, dear readers. Time for the second article of highly useful, cool and fun utilities, commands, and tricks that should help you gain better productivity and understand your system better. In the first part, we learned about a whole bunch of great things, including top in batch mode, how to read process account logs, how to measure system activity with a range of programs, and how to write a simple UDP server-client.

Now, let’s see a few more tricks that will help you master a higher, cooler level of Linux knowledge and allow you to impress you significant others, including your boss.

1. Sparse files

What they be, you’re askin’. Well, sparse files are normal files – except that blocks containing only zeros are not really counted. In other words, empty space inside sparse files is just listed, without actually taking any physical space. This, in contrast to regular files, where everything is preallocated, including bits that hold no data.

If you’re a fan of virtualization, you have come across sparse files – virtual machines disks can be sparse files. If you’re creating virtual machines with, say 10GB space, but do not preallocate it, then you have witnessed sparse files in action! Dynamically expanding virtual disks are sparse files.

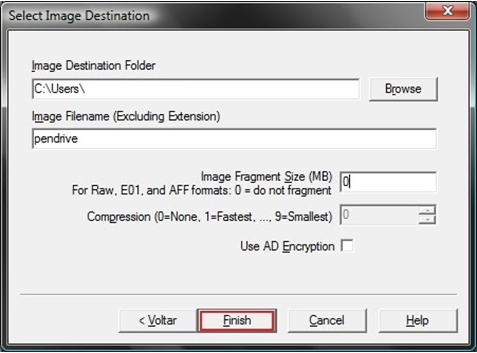
Sparse files have an advantage of conserving space until needed, but if you convert them back to raw format, like during the conversion of VMDK virtual disks to AM2 format for the use in Amazon EC2 cloud, then the files will be inflated back to their normal size. Now, the big question is, why sparse files, and what are they good for?

Well, sparse files are definitely useful in virtualization, but they have other uses. For example, when creating archives or copying files, you may or may not want to use the sparse option, depending on your requirements. Let’s see how we can create sparse and identify sparse files, so we can treat them accordingly.

Create sparse files

Creating sparse files is very simple. Just move the pointer to the end of the file.

dd if=/dev/zero of=file bs=1 count=0 seek=1M

For example, here we have created a zero-size file, except the metadata, which by default will take the customary block size (say 4096 bytes). But we have also moved the pointer to the end of the file, at 1M location, this creating a virtual 1MB file.

Sparse create

Now, using the ls command, you may think it’s a regular file:

Reported size

But you need the -s flag in the ls command options to really know what’s happening. The first field in the output will be the file size, in KB:

Real

Similarly, you can use the du command to get the accurate report:

du command

Just for comparison, here’s what a real, 1MB file reports:

ls real file

du real file

Pay attention to this when working with files. Do not get confused by crazy ls readings, because you may end up with a total that exceeds the real disk size. Use the appropriate flags to get the real status.

Moreover, pay attention when working with file handling, compressing and archiving tools, like cp, tar, zip, and others. For instance, cp has an option that specifies how the sparse files should be handled.

man page

2. Having fun with atop

It’s not a spelling error, there’s no space missing between the letter a and top. atop is a top utility, with some spice. The full description is AT Computing’s System & Process Monitor, an interactive utility to view the load on a Linux system. It can do everything top does, and then some.

atop is a very useful program and you’ll fall in love instantly. The main view is very similar to the original tool, except you have more info and it’s arranged in a more intuitive fashion. You’ll also have color readings for critical percentage of resource usage.

Main

In the bottom half of the main view, you will be able to sort the process table based on different columns, like memory or disk. Press m to sort by memory in the descending order. Press d to sort by disk activity in the descending order.

Memory

Disk

You can save data into flat files, any which way you want.

Log

Better yet, you can also write data to logs in compressed, binary form and then parse relevant fields, compiling useful time-dependent statistics about your system load and usage, helping identify bottlenecks and problems. The manual page is very details and provides examples to get you started instantly.

For instance, the following command:

atop -w /tmp/atop.raw 30 10

will collect the raw data every thirty seconds a total of ten times. Very similar to iostat and vmstat, as we’ve seen the last time. Afterwards, you can pull out desired subsets very easily.

For example, to view the processor and disk utilization of this file in parseable format:

atop -PCPU,DSK -r /tmp/atop.raw

Here’s what the data looks like:

Parsed

Now, if you don’t like the separator, just remove it with some simple sed-ing.

sed -e ‘/^SEP$/d’ /tmp/atop.raw > /tmp/f-clean.csv

Then, you can open this file in, say OpenOffice and create some impressive graphs:

Data

Graph

3. ASCII art

ASCII art won’t make you an expert, but it can be fun. Oh, I’m not talking about using high-end tools like GIMP; anyone can do that. I’m talking about deriving fun ASCII art from the command line.

There are several ways you can achieve this, we will see two.

boxes

boxes is a neat little utility that lets you create your own command-line fortune cookies, similar to what Linux Mint does. The tool has a number of template ASCII figures available, on top of which you add your own little slogans.

boxes is available in most repositories, so go grab it. Then, start playing. For example, to have a cute little kitten write something witty in your terminal, run boxes -d cat, type your own message and hit Ctrl + D to end. Soon thereafter, a little cat will show in the terminal, along with your own message.

boxes cat

Innocent, sweet and fun.

jp2a

This ominous sounding command is not one of those robots in Star Wars. It’s a utility that can convert JPEG images, any one you want, into ASCII art. Very useful and impressive.

For example, take your stock Tux. Now, the image I found was in the PNG format and jp2a does not handle these. So I had to convert the image to JPEG first.

Tux

And then, just run the command against the image name and Voila! Tux is your uncle!

Tux converted

4. xargs

xargs sounds like a peon curse from Warcraft I-III, but it’s in fact a very powerful and useful command that builds and executes commands from the standard input. In other words, when you use complex chains of commands in Linux, sometimes separated by the pipe symbol (|), you may want to feed the output of the last command into the input of the next one. But things can get complicated.

Luckily, xargs can do everything you need. Let’s see a few simple examples.

Example 1:

We will display all the users listed in the /etc/passwd file. Then, we will sort them and print them to the console, each on a separate line.

The command we need is:

cut -d: -f1 < /etc/passwd | sort | xargs echo |
tr ‘ ‘ ‘\n’

Example 1

xargs takes the list of usernames, one by one, echoes them to the console, while the tr command separates into each line, replacing the space delimiter with a new line feed.

Example 2:

Here’s another example. xargs is particularly useful when run with the find command and quite often sed. Let’s say you want to find a list of certain files in your directory and then manipulate them, including changing their permissions, deleting them or just listing them.

With xargs, you can make this affair a one-liner.

find . -type f -print0 | xargs -0 ls

Example 2

Here we’re using xargs with the -0 flag, which instructs it to ignore whitespaces and treat slashes and backslashes literally, making it quite useful if you expect your files to contain quotes, spaces and other exotic characters. To do this, xargs requires the find command to provide input in the right format, which is exactly what the -print0 flag does.

If you’re not convinced xargs is mighty, try doing a few exercises without it and see if you can manage to get the job done in a single line of shell code.

5. Swapon/swapoff

Another allegory, Karate Kid. Wax on, wax off. Except that we’re dealing with the command that handles swap files on Linux. I do not know how often you will have to handle swap manually, but if you’re using live CDs or work with RAID, then you just might.

swapon/swapoff allows you to turn on/off swap devices, set their priority and just plain list them. Changing the priority could be useful if you have swaps of different sizes or set on disks with different speeds.

For example, to view all swap devices:

swapon -s

A screenshot of a typical output:

swapon

And sometimes, you just may want to turn swap off. For example, swap may be used by the live CD, preventing you from unmounting the disk for partitioning, which could lead to errors. In this case, a simple swapoff will do the trick.

Speaking of disks and speeds …

6. Use ramdisk for lightning-fast execution

RAM is not cheap and you should not waste it as simple storage space if you need not to, but sometimes, just sometimes, you may be in a bit of a hurry and would like to get your project completed as soon as possible. If your work entails quite a bit of disk activity, which is usually the bottleneck of the program execution on modern machines, then using a ramdisk could help.

ramdisk is a file system created in the system memory (RAM) and treated as a regular disk device, hence its name. For all practical purposes, if you give someone a system with a RAM disk, they won’t know the difference, except the speed. ramdisks are much faster.

Here’s a little demo.

First, let’s create a ramdisk (as root or sudo):

sudo mount -t tmpfs none /tmp/ramdisk -o size=50M

Create

We created a 50M disk and mounted it under /tmp/ramdisk. And now, let’s compare some basic writes …

Normal disk:

Slow

RAM disk:

Fast

Of course, the results will depend on many factors, including system load, disk type and speed, memory type and speed, and whatnot, but even my 23-second demonstration shows that using ramdisk you can boost your performance by 50% of more. And if you attempt repetitive serial tasks like copy, you will be able to improve your execution time by perhaps an order of magnitude.

7. Perl timeout (alarm) function

Again, Perl as the last item. Now, I have to reiterate, I’m not a skilled Perl writer. I am a cunning linguist and a master debater, but my Perl skills are moderate, so don’t take my perling advice as a holy grail. But you should definitely be familiar with the timeout function, or rather – alarm.

Why alarm?

Well, it allows you to gracefully terminate a process with SIGALARM after a given timeout period, without having your program stuck forever, waiting for something to happen.

Now, let’s see an example. If you’ve read my strace article, then this little demo should remind you of some of the things we’ve seen there.

#!/usr/bin/perl

use strict;
my $debug=1;

eval {
local $SIG{ALRM} = sub { die “alarm\n” }; # NB: \n required
alarm 5; # timeout after 5 seconds without response
system(“/bin/ping -c 1 @ARGV[0] > /dev/null”);
alarm 0;
};

if ($@) {
die unless $@ eq “alarm\n”;   # propagate unexpected errors
print “\nWe could not ping the desired address!\n\n” if $debug;
# timed out
}

else {
print “\nWe’re good!\n\n” if $debug;
}

What do we have here? Well, a rather simple program. Let’s examine the different bits separately. The first few lines are quite basic. We have the perl declaration, the use of strict coding, which is always recommended, and a debug flag, which will print all kinds of debugging messages when set to true. Rather useful when testing your own stuff.

Next, the eval function, which tells the program to die with ALRM signal if the desired functionality is not achieved within the given time window (in seconds). Our example is a simple ping command, which takes the IP address as the input argument and tries to get a reply within five seconds.

eval {
local $SIG{ALRM} = sub { die “alarm\n” }; # NB: \n required
alarm 5; # timeout after 5 seconds without response
system(“/bin/ping -c 1 @ARGV[0] > /dev/null”);
alarm 0;
};

Next, we set the program to exit if there are error messages ($@), printing a message to the user that informs him/er that we could not ping the desired address. What more, if the program execution got botched for some reason other than our timed alarm, we will terminate the execution, thus covering all angles. If successful, we continue with our work, plus some encouraging messages.

if ($@) {
die unless $@ eq “alarm\n”;   # propagate unexpected errors
print “\nWe could not ping the desired address!\n\n” if $debug;
# timed out
}

else {
print “\nWe’re good!\n\n” if $debug;
}

Some screenshots … Here’s the perl code. P.S. Just noticed the 10 seconds in the comment after alert 5; Well, it’s an innocent error, but it does not affect the code, so you can ignore it.

Code

Then, we have a good example:

Good

And a bad one:

Bad

And just to show you it’s a five-second timeout we’re talking about, I’ve used the time command to … well, time the execution of the script run:

Time

ping is just a silly example, but you can use other, more complex functions. For example, mount commands. In combination with strace, which we’ve seen a few weeks ago, you can have a powerful trapping mechanism for efficient system debugging.

To read more about alarm, try the official documentation: perldoc -f alarm. To this end, you will need the perl documentation package installed on your system.

Why this exercise?

Well, it emphasizes the importance of proper checks when coding programs that use external inputs and outputs to work. Since you cannot guarantee that the other bits of code will cooperate with yours, you need to place failsafe checks to make sure you can gracefully complete the run without getting stuck. Along with input validation, timeouts and error exits are an integral part of cavalier programming.

Conclusion

That’s it, seven lovelies this time. A magnificent seven. I did promise you sec, but it’s too large to be just a bullet item. We will have a separate article soon, probably as a super-duper admin tool.

Anyhow, today you’ve learned several more useful tools, tricks and commands that should help you understand better your environment, work more smartly and be able to control and monitor your systems more effectively. Best of all, the tips given do not really require any specific platform. Any Linux will do. I used openSUSE 11.2, Ubuntu Jaunty and Ubuntu Karmic for these demos.

I hope you appreciate the combined effort. Stay tuned for more. We’ll have several more compilations as well as dedicated, detailed articles on some of the more powerful programs available, including both mid-end and high-end tools, as well as advanced system debugging utilities.


Welcome to the third installment in the Linux cool hacks series. Like the previous two, this article is all about cool things you can do with your Linux that are not well known and yet rather useful. When I say cool, this applies to laughing hard at XKCD’s sudo make me a sandwich style of people rather than someone wearing Zara flipflops, although those are not mutually exclusive.

Anyhow, we’ve had some 17 tips so far. Let’s try a few more. I will demonstrate using Ubuntu, openSUSE andCentOS, to show you that the choice of the system does not really make much difference. So please join me. Tomorrow, after having read and practiced these tricks, you will be able to impress your significant others and colleagues and there ought to be much rejoicing.

1. Show (kernel) functions in ps output

This is an interesting need. Say you have a program that is misbehaving. You do not want or cannot attach the debugger to it, as you fear you may disrupt some delicate time-race condition or possibly even crash the application. Or it may be stuck in a non-debuggable state. Or it may not have symbols or deny ptrace hooks or who knows what else. All in all, lots of geek lingo, the bottom line is, you just want to know at what stage the execution of the software is stuck, in the quickest, least intrusive way possible. ps will do.

This one specific example is even written in the man page:

ps -eo pid,tid,class,rtprio,ni,pri,psr,pcpu,stat,wchan:14,comm

And you will be able to see in the WCHAN column, the last function being used by your process. Most of the time, this will be completely meaningless, but if you have an inkling of understanding how your process ought to behave or you might be a developer, this could be useful information.

ps, wchan

2. Nohup

Nohup is a special Linux command that lets you detach processes from their shell, allowing them to run in what you might want to refer to as the background service mode. Indeed, if you take a look at the process table (ps), you will see a lot of processes that were spawned by the system and run without a tty.

When you start a program from the command line, it will live within the shell of your terminal window, even if you background it with &. When you kill the shell, all of its children processes will die too. In a few select cases, we want to avoid this, so we need a mechanism that will detach processes from their shell. A simple method is to create a startup script and add it to /etc/init.d, but this should really be reserved to services.

So nohup will daemonize our processes – make them daemons. Sounds scary, but it’s just geek lingo designed to impress girls. Anyhow, nohup is invoked against the desired binary or script. You need a full path if the binary or script are not presented in the PATH. You must also background nohup itself, so that it detached from the shell.

nohup <command> &

Nohup will redirect the output to nohup.out in the current directory. You should also make sure to use the proper redirection for the standard input, output and error to avoid hangs.

Here’s an example. Notice that script.sh runs without a terminal, as denoted by ? in the sixth column. For instance, the grep command runs on the virtual terminal pts/3. Moreover, script.sh is parented by init (PID = 1). And you can also see the nohup output, which is just a silly echo in this example.

Nohup

3. Fallocate

Fallocate sounds a meme, but it is a very neat command that can save you a lot of time. To prove that, let me ask you a question first. What do you do if you need to create a very large file, which cannot be sparse? You use dd and source the bit stream from /dev/zero, but this takes a long time. It’s normally limited by the device speed, which is about 80MB/s for most disks. So if you need to create an 80GB file, you will need some twenty minutes to do that, in the best case. With USB connections and slower disks, this can grow to 40 minutes or longer. fallocate solves the problem by preallocating blocks instantly.

This is a relatively new command and system call in the Linux kernel, available since revision 2.6.23. All right, let us demonstrate.

First, we create a 10MB file. Nothing special. But then, to show you how powerful this command really is, we will compare with dd. While files this small could easily be written to disk cache, masking the true speed, the demonstration is powerful enough without having to use large files.

fallocate -l 10m 10mbfile

fallocate

Now, the comparison. Notice the actual time differences between fallocate and dd. Even for such a tiny file, the difference is huge. fallocate is some 70 times faster in terms of system time, even though the entire operation took a fraction of the second.

fallocate speed

dd speed

Now, fallocate will remain as fast, without any regard to file size, while dd times will increase. When you have to create files that are several GB is size or much larger, you will appreciate this capability. For example, you may need to create swap files in this manner and preallocate them to partitions during the installation setup. You might not be able to wait long minutes or possibly hours for this operation to complete. Fallocate resolves the problem.

4. Debug filesystems (debugfs)

Debugfs is an interactive tool for managing EXT filesystems. Invoked from the command line, it allows you to change the mode, block size, write to the superblock, force the filesystem to execute specific commands, and more. Naturally, this kind of work means you know what you’re doing and you’re well aware of the potential hazards of data corruption when working against devices and their filesystems in a sort of live operation mode.

debugfs is invoked against the desired target device. By default, it will open the filesystem in read-only mode, as a precaution. This is quite useful for trying to salvage data from corrupted filesystems. Other commands that come into mind when trying to work with filesystems include tune2fs and resize2fs.

Debugfs

5. Blacklisting drivers

The Linux kernel comes with a ton of drivers, some compiled into the kernel, during the kernel compilation, which is done by specifying Y, some available as dynamically loadable modules, which is done by specifying M. The modules will later show under /lib/modules, matching your kernel.

Now, the kernel footprint could be big and contain too many drivers that you do not need or even contain conflicting drivers that interfere with your work. For instance, you might not want ipv6, which is something we tried in my Realtek network troubleshooting on Kubuntu Natty on my latest desktop, or perhaps you might not want the Nouveau graphics driver, as it conflicts with the Nvidia driver and prevents its installation, as we have seen in my CentOS Nvidia guide.

There are several ways you can disable drivers – by blacklisting them. Not a new thing, we’ve done the same back in 2006 with my Linux guide of highly useful configurations. You can make permanent changes by editing files on your system or pass parameters to the kernel commandline in the GRUB menu.

Using the CentOS example, you can disable the Nouveau driver by appending the following string to the kernel command line:

kernel /boot/vmlinuz <all kinds of options> rdblacklist=nouveau

Oncer your system boots and you are 100% confident the change works well, then you can make the change permanent, either by editing the GRUB menu or by editing the driver to the /etc/modprobe.d/blacklist or /etc/modprobe.d/blacklist.conf file, depending on your distribution.

echo “driver name” >> /etc/modprobe.d/blacklist

Please make sure you have backups before you permanently alert your system. Finally, some drivers will have writable parameters exposed under /proc and /sys, allowing you to echo new values on the fly and make changes as necessary. We will discuss that a while later.

6. Browsing the kernel stuff

This is a vague title, but what I’m referring to is the capability to quickly inspect kernel functions, check header files, determine whether your applications are trying to run code that belongs to the kernel or something else and so forth. To this end, there are many tools you can use. We’ll examine a few.

First, you can go online lxr – The Linux Cross Reference site, which indexes all source code in the kernel repositories. So if you’re looking some function, just input the name or part thereof into the search box and start reading.

LXR site

Then, there’s cscope, which we saw in the Kernel Crash Book. If you have kernel sources installed on your machine, you will be able to check what functions, text strings, symbols and definitions are declared in different source files. This is quite useful if you are trying to debug problems with your applications or perhaps even kernel crashes. To that end, you might also be interested in ctags.

cscope

7. Some extras

The tips listed below will probably not serve you that often, but it is good to know about them. Almost like hoarding water for the nuclear winter, so to speak, only more fun. Now, please note that you cannot follow the advice below at all!

It’s a sort of a paradox, but unlike so many people out there, I will not give you blanket suggestions on how to utilize your machines, as every single use case is different. Saying that X will speed Y is utterly and morally wrong. One man’s tweak blessing is another’s curse. Do not even change configuration because someone somewhere said it ought to work, make your system work faster, be more responsive, etc. 99% of these wild and happy recommendations are valid for single home machines with no regard to reality, especially not businesses with heavily loaded production servers. Therefore, be aware of the possibilities, study them carefully and then apply your best formula.

/proc and /sys tunables

Explaining what /proc and /sys do is beyond the scope of this article by three whole quantum leaps. But they are very important pseudo-filesystems that let you tweak all kinds of things, on the fly, no reboot required.

In this section, I will try to elaborate on several useful features, like CPU affinity, memory tunables, scheduling, and a few other items that will normally earn you a good beating your neighbors if you ever speak of them in public. Let’s do it.

For example, if you have a multi-processor system that does very specific tasks, you might want to bypass the internal scheduling mechanisms and force your cores to process only certain workloads. Normally, this tradeoff usually has more problems than benefits, so please don’t make any changes just for the sake of being cool.

To give you a practical example, you might want to assign interrupt handling for most heavily used network channels to CPU1, while allowing the rest of the tasks to work on CPU2. Indeed, if you have a box that has several network devices and churns data like mad, loading one specific processor might be a good idea in ensuring the quality of service for other tasks. Then again, you could ruin everything, so be careful.

To get this going, you need the processor bitmask, which you can derive from the number of available processors on your box, as well as the corresponding interrupt for the channel you wish to assign to a specific processor.

cat /proc/cpuinfo

cat /proc/interrupts

Interrupts

And then, we do the magic – force IRQ 30 (Wireless, iwlagn) to processor 1:

echo 1 > /proc/irq/30/smp_affinity

Of course, your kernel must be capable of symmetric multi-processing, which is a default in all new kernels. It’s not a given for older kernels like 2.6.16 and 2.6.18 in previous but still much used enterprise editions of SUSE and RedHat.

More reading here: http://www.cs.uwaterloo.ca/~brecht/servers/apic/SMP-affinity.txt.

Memory management

Linux memory management is the blackest of magics in the world. But it’s a fun thing, especially if you know what you’re doing. Like I mentioned before, no one setting will work for everyone. There’s no golden rule. The system defaults are as good as empirically possible for the widest range of uses, so you should stick with that.

If however, you feel really adventurous, you might want to explore the kernel tunables under /proc/sys/vm. There are several of those.

The swappiness parameter tells you how aggressively your system will try to swap pages. The values range from 0 to 100. In most cases, your disk will always be the bottleneck, so it will make little difference. Then, there’s the dirty_ratio tunable, which tells the percentage of total system memory that can be taken by dirty pages. Once this limit is hit, the system will start flushing data to the disk. Another parameter that is closely related to the dirty_ratio is dirty_expire_centisecs, which determines the max. age of dirty pages before they are flushed. The system will commit the dirty data based on the first of the two parameters to be met, which will most likely be the expire time.

Centisecs value

A mental exercise: the default dirty_ratio on Linux is 40%, while the default expire tunable is set to 3000 centiseconds. A centisecond is 1/100 of a second or 10ms, so we have 30 seconds total. If you have a machine with 4GB RAM, then 1.6GB will be dedicated to dirty pages at most. Now, this means that whatever you’re writing, it needs to create some 55MB of data every second to exceed this threshold in the thirty-second period for the kernel flushing thread to wake and start writing to the disk. In most cases, you will rarely have such aggressive writes. Some notable examples include large copies, video rendering and alike. In daily use, hardly ever. If you have more than 4GB RAM, say 8-16GB, then this becomes even less likely.

This exercise also tells you whether you really need that high dirty_ratio, how to set the other tunables and more. Having too many dirty pages also means very long and sustained writes when the time comes to commit them to disk. Food for thought, fellas. There’s no golden rule.

As you can see, I’m breezing through these extremely lengthy and complex topics, but the idea is not to write a PhD on memory management, but give you a very brief sampling of the possibilities, so you can later explore and use them.

You can make changes by echoing values to /proc or using sysctl.

A very geeky read (direct link) for RHEL4, but still very much relevant today.

Another thing you may want to attempt is to allow/disallow memory overcommitment. Normally, Linux uses smart heuristics for managing overcommittment, but if you are really worried about how your system handles out its quiche to processes, then you can disable the overcommittment or set a ratio. I would recommend against any changes, unless you have very strict requirements, you cannot afford OOM mechanism to work, etc.

I/O scheduling

Another geeky item, best left alone. But if you must, please read on. First of all, most I/O elevator algorithms assume platter-based disks, so if you’re running with SSD, the rules of the game changes, but this has been taken into account in recent kernels. Assuming you’re running on plain old mechanical hardware, then you have one simple goal: as few seeks as possible to minimize access times and wear, which translate into user responsiveness latency. But then, some of your machines might be running pure computation tasks, so the responsiveness might not be an issue.

But in general, we want to perform write operations in bursts, as much data as possible. There are four available schedulers: noop – most basic, dispatches requests as they come, normally good for disks on key and systems with heavy CPU usage; anticipatory – longer delays, so there’s more chance for starvation, however it tries to maximize throughput and reduce seeks; cfq – better known as completely fair queue scheduler, it relies on processes behavior and can be used with ionice to achieve balanced throughputs. It does not prefer writes or reads; deadline – this one tries to dispatch as quickly as possible, treating tasks as real-time, in order to avoid process starvation.

You can issue the change per disk:

echo <scheduler> > /sys/block/<device>/queue/scheduler

For instance:

echo cfq > /sys/block/sdb/queue/scheduler

All this sounds dandy, but the real challenge is figuring out what your machines are doing and match the behavior accordingly. After you have made the change, you will need to test your results. In the Linux world, you will most commonly find cfq or anticipatory as the default choice.

Of course, if you make changes to the scheduler, then you might also want to tweak the readahead settings, both the readahead max. value and the throughput value, as well as the number of simultaneous I/O requests. The corresponding tunables include nr_requests, read_ahead_kb and inode_readahead_blks. Some of the values will be limited by the filesystem choice. Let me disappoint you and tell you that you will have to work hard to see significant improvements.

Some reading on schedulers: Linux Journal – I/O Schedulers.

Filesystem mount options

Like the disk, we want speed. That’s the basic driver here. So let’s see what kind of options we can use. The most notable focus is on the journaling capabilities of modern filesystems.

This is another black magic, but something you can test with relative safety. Choose any old disk, preferably with a single partition to avoid masking results by typical disk speed bottlenecks. Then, test various mount options. Some of the notable performance boosters so to speak include:

writeback mode – only the metadata is journaled, and the data blocks are written directly to their location on the disk. This preserves the filesystem structure and avoids corruption, but data corruption can occur. For example, if the system crashes after the metadata is journaled but before the data block is written.

ordered mode – metadata journaling is done after the data is written to the disk. In this way, data and filesystem are guaranteed consistent after a recovery.

data mode – both metadata and data are journaled. This mode offers the greatest protection against file system corruption and data loss but can suffer from performance degradation, as all data is written twice (first to the journal, then to the disk).

Some more reading: Anatomy of Linux journaling filesystems.

All right, now that we know what we need, we can simply mount a filesystem with the  writeback option. You should test extensively, to make sure things work out find, or at the very least, use this option for filesystems with heavy access but that might not be containing critical data.

mount -o data=writeback /dev/<device>  /<mountpoint>

You might also want to consider noatime and nodiratime, but again don’t listen to one geek trying to impress you with words, do your own testing and prove everyone else wrong.

And I guess that would be enough for today. Other items that you might want to look at include slabinfo/slabtop, huge pages and Table Lookaside Buffers (TLB). That’s different from LTB, which stands for Tomato Lettuce and Bacon, a different kind of hack. Some screenshots and we’re done here.

slabinfo, slabtop

Huge pages config

Conclusion

There you go, another lovely set of geekiness. Again, the real value in these hacks is the exposure not the actual application. Be aware of the functionality, study it, and then apply it to your personal or business needs one day. And remember that no two computers and use cases are the same, so blind copy & paste will not work.

That would be all, I guess. You are also welcome to check the first and the second article, as well as the whole series of so-called super-duper admin tools. We will also have an extensive review on the Gnu Debugger (gdb) soon. Stay pretty.


Once article numbers start to run high, people tend to start paying less attention to the content. However, by no means does that make this article any less useful or interesting. I happen to have a fresh new bunch of tips and tricks that ought to increase your Linux street credit.

In the first two parts, we focused on system administration mostly. The third part focused on system internals. This fourth chapter will elaborate on compilation and fiddling with Linux binaries, specifically the ELF format. Again, not everyone’s lunch or dinner, but some of you may appreciate the extra geekiness I devoted to making your lives easier. So please follow me.

Teaser

1. Learn more about the file – no strings attached

Say you have a binary of some sort – a utility, a shared object, a kernel module, maybe even an entire kernel. Now, using file will give some very basic information on what kind of object you’re dealing with. But there’s more. Strings. Now, the subtitle makes a lot of punny sense, hihihihihihi.

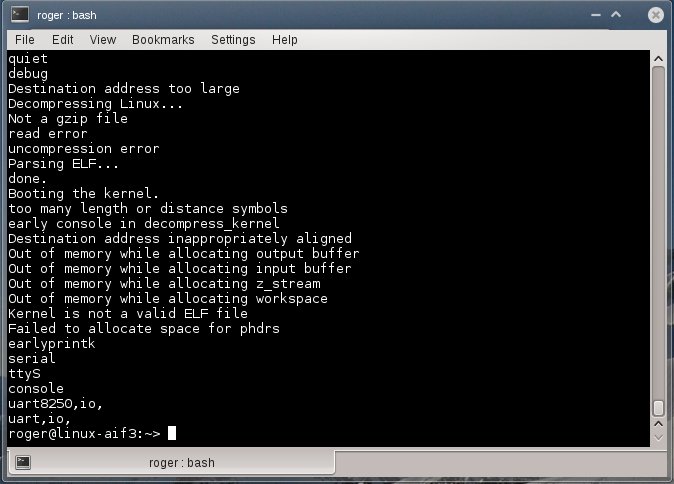
Strings is a very useful command that can pull out all printable characters out of binary files. This can be quite useful if you need to know the would-be meta data, like compiler versions, compilation options, author, etc. For example, here’s what it looks like for a kernel vmlinuz file. Some of you may actually recognize some of the print messages there.

Strings

2. Debugging symbols

Now, say you wish to debug your faulty application, but for some reason all of the functions in the backtrace come out with ?? marks. The simple reason is that you may not have debug symbols installed. But how would you know?

Well, apart from checking the installed database of RPM of DEB files, you may want to query the files directly. Again, we will use the file command, and then delve deeper into the system. Here’s an example:

Stripped object

What we see here is that we have a 32-bit Little Endian shared object for the Intel architecture, stripped of symbols. That’s what the last word tell us. This means the binary was compiled without symbols or they have been removed afterward to conserve space and improve performance. We discussed symbols in the Kernel Crash book, too.

So how do you go about having or not having debug symbols? Another highly useful tool that should let you get binary symbols is nm. This tool is specifically designed to get symbols from various sections in the executable file format that is typical on Linux.

For instance, -b flag lets you get symbols for uninitialized global variables in the data section, also known as bss. -C lets you query common symbols, or rather uninitialized data. In our example, there are none available, because our shared library is stripped.

nm example

However, if you query with -D flag, you will get symbols in the initialized data section.

Global table

For most people, this information is completely useless. But for senior system admins and software developers, knowing exactly the mapping of code in a binary and translation of memory addresses to function names is essential.

Playing with symbols – objdump, objcopy, readelf

We can add and remove them, as we please, after the compilation. To that end, we will use several handy utilities, including objcopy and readelf. The first allows manipulating object files. The second lets you read data from binary files in a structured human readable format.

We will begin with readelf. The simplest way is to dump everything. This can be done using -a flag, but beware the torrents of information, which probably won’t mean much to anyone but developers and hackers. Still good to know and impress girls.

readelf, all

Another useful flag is –debug-dump=info. You might be interested in debuginfo only. Here, specifically, we compile our test tool with debug symbols, and then display the info. Please note that we have a lot of information here:

Debuginfo not stripped

Now, objcopy can manipulate files so that above information is shown, not shown or used elsewhere. For instance, you might want to compile a binary with debug symbols for testing purposes, but distribute a stripped version to your customers. Let’s see a few practical use cases.

To remove debug info from the original binary:

objcopy –strip-debug foo

This will result in a stripped binary, just like we saw earlier. But then, you might not want to toss away those symbols permanently. To that end, you can extract debug info and keep it into separate file:

objcopy –only-keep-debug foo foo.dbg

And then, you can link debug info back to the stripped binary when you need it:

objcopy –add-gnu-debuglink=foo.dbg foo

On the far end of the spectrum, we get objdump, another handy utility. Again, we used the program before, when playing with kernel crashes, so we are no strangers to its power and functionality. Similar to readelf, objdump let us obtain information from object files. For example, you may be interested in the comment section of your binary:

objdump, comments

Or you may want everything:

All

Combined example

Now, let’s see this in practice. First, we compile our code with -g flag. The binary weighs some 18299 bytes. Then, we strip debug information using objcopy. The resulting binary is now much smaller, at 13042 bytes. And readelf shows nothing, unlike before.

Remove symbols

3. Compilation optimization tips

When compiling your code, there are a billion flags you can use to make you code more efficient, leaner, more compact, easier to debug, or something else entirely. What I want to focus on here is the optimization during the compilation. GCC, which can be considered a de-facto compiler on pretty much any Linux, has the ability to optimize your code. Quoting from the original website:

Without any optimization option, the compiler’s goal is to reduce the cost of compilation and to make debugging produce the expected results. Statements are independent; if you stop the program with a breakpoint, you can then assign a new value to any variable or change the program counter to any other statement in the function and get exactly the results you would expect from the source code. Turning on optimization flags makes the compiler attempt to improve the performance and/or code size at the expense of compilation time and possibly the ability to debug the program.

In other words, the compiler can perform optimizations based on the knowledge it has of the program. This is done by intermixing your C language with Assembly in numerous ways. For example, simple arithmetic procedures of constant values can be skipped altogether and the final results returned, saving time.

Optimizations can affect binary file size and its speed or both. At the same time, it will be much harder to debug, because some of the instructions may be omitted. Moreover, the compilation time will probably be longer. Overall, -O2 levels offers a good compromise between user’s ability to debug, size and performance. It is also possible to recompile code with -O0 level for debugging purposes only and ship to customers with the lean image.

GCC optimization

Here’s another interesting article on optimizations.

4. LDD (List Dynamic Dependencies)

When you try to run your applications, they may sometimes refuse to start, complaining about missing libraries. This can happen for several reasons, including permissions, badly configured path or an actual missing library. To be to know exactly what’s going on, there’s a neat little utility called LDD. It allows you to print shared library dependencies for your binaries. You should use it.

LDD

LD_PRELOAD and LD_LIBRARY_PATH

As I’ve mentioned just moments earlier, the system path can impact the successful startup of applications. For example, you may have several libraries under /opt, but /opt is not defined in the search path, which may only include /lib and /lib64, for instance. When you try to fire up your program, it will fail, not having found the libraries, even though they are physically there. You can work around this issue without copying files around by initializing environment variables that will tell the system where to look.

The word system sounds almighty here, so perhaps a short introduction in how things work might be in order. In Linux, there’s the super-tool called dynamic linker/loader, which does the task of finding and loading libraries for programs to run. ld.so is a smart and efficient tool, so it does not perform a full-system search every time it needs to fire up a binary. Instead, it has its own mini-database, stored under /etc/ld.so.cache, which contains a compiled list of search libraries and an ordered list of candidate libraries. It’s somewhat similar to the locate program.

This list is updated by running ldconfig, which most Linux systems execute either during startup or shutdown, but it can be manually run whenever the /etc/ld.so.conf file, which contains the list of search libraries, is updated. This also happens after installations of software.

If the linker cannot find libraries, the loading of the program will fail. And you can use LDD to see exactly what gives. Then, you can use the environment variables LD_PRELOAD and LD_LIBRARY_PATH to force loading of libraries outside the search path.

There is some difference between the two. LD_PRELOAD will force loading of these libraries before any other. LD_LIBRARY_PATH is similar to standard PATH. There are many other variables you can change, but that’s what the man page is for.

One last hack that you might be interested in is rpath. It allows hard-coding runtime search paths directly into the executable, which might be necessary if you’re using several versions of the same shared library, for instance.

Recursive implementation

LDD displays only unique values. But you might be interested in a recursive implementation. To that end, you might want to check the Recursive LDD tool, available for download at Sourceforge.net. It’s a simple Perl script, with some nice tweaks and options. Quite useful for debugging software problems.

Recursive LDD

5. Some more gdb tips

We learned a lot about gdb. Now, let’s learn some more. Specifically, I want to talk to you about the Text User Interface (TUI) functionality. What you want to do is fire up the venerable debugger with -tui option. Then, you will have a sort of a split-screen view of both your code and the gdb prompt, allowing you to debug with higher visual clarity. All the usual tricks still apply.

GDB -tui

You might also be interested in this article.

6. Other tips

The one last extra tip is about translating addresses into file names and line numbers. addr2line translates addresses into file names and line numbers. Given an address in an executable or an offset in a section of a relocatable object, it uses the debugging information to figure out which file name and line number are associated with it.

addr2line <addr> -e <executable>

A geeky example; say you have a misbehaving program. And then you run it under a debugger and get a backtrace. Now, let’s assume we have a problematic frame:

# C  [libz.so.1+0xa910]  gzdirect+0x28

All right, so we translate (-e tells us the name of the object). Works both ways. You can translate from offsets to functions and line numbers and vice versa. Again, this can be quite handy for debugging, but you must be familiar with the application and its source.

addr2line 0xa910 -e libz.so.1
/tmp/zlib/zlib-1.2.5/gzread.c:614

addr2line -f -e libz.so.1.2.5 0xa910
gzdirect  ? function name
/tmp/zlib/zlib-1.2.5/gzread.c:614

More reading

You might also want to check these:

Linux super-duper admin tools: strace and lsof

Linux system debugging super tutorial

Highly useful Linux commands & configurations

Conclusion

I assume this article is only for the brave, bold and beautiful. It’s definitely not something the absolute majority of you will ever want, need, see, try, require, or anything of that sort. But then, if you’re after impressing girls, there’s no better way of doing it.

Along that noble cause, this tutorial also presents some handy tips for software development and debugging, which, combined with a deep understanding of system internals and wise use of tools like strace, lsof, gdb, and others, can provide an awesome wealth of useful information. We learned how to read and extract information from files, how to work with symbols, how to read the binary format, compilation tips, dynamic dependencies, and several other tweaks and hacks. That should keep you busy for a week or there until you figure out everything. Meanwhile, do send me any ideas you may have on similar topics, if you feel there ought to be a tutorial out there. And see you around.

Cracking MD5, phpBB, MySQL and SHA1 passwords with Hashcat on Kali Linux


Hashcat or cudaHashcat is the self-proclaimed world’s fastest CPU-based password recovery tool. Versions are available for Linux, OSX, and Windows and can come in CPU-based or GPU-based variants. Hashcat or cudaHashcat currently supports a large range of hashing algorithms, including: Microsoft LM Hashes, MD4, MD5, SHA-family, Unix Crypt formats, MySQL, Cisco PIX, and many others.

Hashcat or cudaHashcat comes in two main variants:

  1. Hashcat – A CPU-based password recovery tool
  2. oclHashcat or cudaHashcat – A GPU-accelerated tool

Many of the algorithms supported by Hashcat or cudaHashcat can be cracked in a shorter time by using the well-documented GPU-acceleration leveraged in oclHashcat or cudaHashcat (such as MD5, SHA1, and others). However, not all algorithms can be accelerated by leveraging GPUs.

Hashcat or cudaHashcat is available for Linux, OSX and Windows. oclHashcat or cudaHashcat is only available for Linux and Windows due to improper implementations in OpenCL on OSX.

My Setup

My setup is simple. I have a NVIDIA GTX 210 Graphics card in my machine running Kali Linux 1.0.6 and will use rockyou dictionary for this whole exercise. In this post, I will show How to crack few of the most common hashes

  1. MD5
  2. MD5 – phpBB
  3. MySQL and
  4. SHA1

I will use 2 commands for every hash, hashcat and then cudahashcat. Because I am using a NVIDIA GPU, I get to use cudaHashcat. If you’re using AMD GPU, then I guess you’ll be using oclHashcat. Correct me if I am wrong here!

AMD is currently much faster in terms of GPU cracking, but then again it really depends on your card.

You can generate more hashes or collect them and attempt to crack them. Becuase I am using a dictionary, (it’s just 135MB), I am limited to selection number of passwords. The bigger your dictionary is, the more you’ll have success cracking an unknown hash. There are other ways to cracking them without using Dictionary (such as RainBow Tables etc.). I will try to cover and explain as much I can. Advanced users, I’m sure you already know these, so I would appreciate constructive comments. As always, read the manual and help file before you ask for help. Most of the things are covered in manuals and wiki available in www.hashcat.net.

A big thanks goes to the Hashcat or cudaHashcat Dev team, they are the ones who created and maintained this so well. Cudos!.

Getting hashes:

First of all, we need to get our hashes. You can download hash generator applications, but there’s online sites that will allow you to create them. I will use InsidePro who kindly created a page that allows you create hashes on the fly and it’s publicly available. Visit them and feel free to browse their website to understand more about hashes.

The password I am using is simple: abc123

All you need to do is enter this in password field of this page http://www.insidepro.com/hashes.php and click on generate.

cracking-md5-phpbb-mysql-and-sha1-passwords-with-hashcat-on-kali-linux-blackmore-ops-18

Cracking hashed MD5 passwords

From the site, I copied the md5 hashed password and put it into a file.

vi md5-1.txt
cat md5-1.txt

MD5 cracking using hashcat and cudahashcat

Now it’s simple, I just typed in the following command and it took few seconds.

hashcat -m 0 -a 0 /root/md5-1.txt /root/rockyou.txt

Similarly, I can use cudahashcat.

cudahashcat -m 0 -a 0 /root/md5-1.txt /root/rockyou.txt

Cracking hashed MD5 – phpBB passwords

From the site, copy the phpBB hashed password and put it into a file.

vi md5phpbb-1.txt
cat md5phpbb-1.txt

What I didn’t explain in previous section, is that how do you know who mode to use or which attack code. You can type in hashcat --helpor cudahashcat --help and read through it. Because I will stick with attack mode 0 (Straight Attack Mode), I just need to adjust the value for -m where you specify which type of hash is that.

hashcat --help | grep php

So it’s 400

MD5 – phpBB cracking using hashcat and cudahashcat

Let’s adjust our command and run it.

hashcat -m 400 -a 0 /root/md5phpbb-1.txt /root/rockyou.txt

and cudahashcat

cudahashcat -m 400 -a 0 /root/md5phpbb-1.txt /root/rockyou.txt

Cracking hashed MySQL passwords

Similar step, we get the file from the website and stick that into a file.

vi mysql-1.txt
cat mysql-1.txt

NOTE: *6691484EA6B50DDDE1926A220DA01FA9E575C18A <– this was the hash from the website, remove * from this one before you save this hash.

cracking-md5-phpbb-mysql-and-sha1-passwords-with-hashcat-on-kali-linux-blackmore-ops-10

First of all let’s find out the mode we need to use for MYSQL password hashes.

hashcat --help | grep My

Ah, I’m not sure which one to use here …

MySQL hashed password cracking using hashcat and cudahashcat

I’ll try 200 and see how that goes …

hashcat -m 200 -a 0 /root/mysql-1.txt /root/rockyou.txt

Nope not good, Let’s try 300 this time…

hashcat -m 300 -a 0 /root/mysql-1.txt /root/rockyou.txt

and cudahashcat

cudahashcat -m 300 -a 0 /root/mysql-1.txt /root/rockyou.txt

Cracking hashed SHA1 passwords

Similar step, we get the file from the website and stick that into a file.

vi sha1-1.txt
cat sha1-1.txt

Let’s find out the mode we need to use for SHA1 password hashes.

hashcat --help | grep SHA1

cracking-md5-phpbb-mysql-and-sha1-passwords-with-hashcat-on-kali-linux-blackmore-ops-14

SHA1 password cracking using hashcat and cudahashcat

We already know what to do next…

hashcat -m 100 -a 0 /root/sha1-1.txt /root/rockyou.txt

and cudahashcat

cudahashcat -m 100 -a 0 /root/sha1-1.txt /root/rockyou.txt

cracking-md5-phpbb-mysql-and-sha1-passwords-with-hashcat-on-kali-linux-blackmore-ops-15

Location of Cracked passwords

Hashcat or cudaHashcat saves all recovered passwords in a file. It will be in the same directory you’ve ran Hashcat or cudaHashcat or oclHashcat. In my case, I’ve ran all command from my home directory which is /root directory.

cat hashcat.pot

cracking-md5-phpbb-mysql-and-sha1-passwords-with-hashcat-on-kali-linux-blackmore-ops-17

Creating HASH’es using Kali

As always, great feedback from zimmaro, Thanks. See his comment below: (I’ve removed IP and email details for obvious reasons).

dude got some massive screen!!! 1920×1080 16:9 HD 1080p!!!

zimmaro_the_g0at
<email truncated>
<ip address truncared>

all always(our-friend):
excellent explanation and thank you for sharing your knowledge / experiences

PS:if I may :-)
some “” basic-hash “” can be generated directly with our KALI

http://www.imagestime.com/show.php/936022_hash.PNG.html

cracking-md5-phpbb-mysql-and-sha1-passwords-with-hashcat-on-kali-linux-blackmore-ops-20-zimmaro

Conclusion

This guide is here to show you how you can crack passwords using simple attack mode.You might ask why I showed the same command over and over again! Well, by the end of this guide, you will never forget the basics. There’s of course advanced usage, but you need to have a strong basics.

I would suggest to read Wiki and Manuals from www.hashcat.net to get a better understanding of rule based attacks because that’s the biggest strength of Hashcat. The guys in Hashcat forums are very knowledgeable and know what they are doing. If you need to know anything, you MUST read manuals before you go and ask something. Usually RTFM is the first response … so yeah, tread lightly.

Thanks for reading. Feel free to share this article.

Website Password & User Credentials Sniffing/Hacking Using WireShark


Did you knew every time you fill in your username and password on a website and press ENTER, you are sending your password. Well, of course you know that. How else you’re going to authenticate yourself to the website?? But, (yes, there’s a small BUT here).. when a website allows you to authenticate using HTTP (PlainText), it is very simple to capture that traffic and later analyze that from any machine over LAN (and even Internet). That bring us to this website password hacking guide that works on any site that is using HTTP protocol for authentication. Well, to do it over Internet, you need to be able to sit on a Gateway or central HUB (BGP routers would do – if you go access and the traffic is routed via that).

But to do it from a LAN is easy and at the same time makes you wonder, how insecure HTTP really is. You could be doing to to your roommate, Work Network or even School, College, University network assuming the network allows broadcast traffic and your LAN card can be set to promiscuous mode.

So lets try this on a simple website. I will hide part of the website name (just for the fact that they are nice people and I respect their privacy.). For the sake of this guide, I will just show everything done on a single machine. As for you, try it between two VirtualBox/VMWare/Physical machines.

p.s. Note that some routers doesn’t broadcast traffic, so it might fail for those particular ones.

Step 1: Start Wireshark and capture traffic

In Kali Linux you can start Wireshark by going to

Application > Kali Linux > Top 10 Security Tools > Wireshark

In Wireshark go to Capture > Interface and tick the interface that applies to you. In my case, I am using a Wireless USB card, so I’ve selected wlan0.

Website Password hacking using WireShark - blackMORE Ops - 1

Ideally you could just press Start button here and Wireshark will start capturing traffic. In case you missed this, you can always capture traffic by going back to Capture > Interface > Start

Website Password hacking using WireShark - blackMORE Ops - 2

Step 2: Filter captured traffic for POST data

At this point Wireshark is listening to all network traffic and capturing them. I opened a browser and signed in a website using my username and password. When the authentication process was complete and I was logged in, I went back and stopped the capture in Wireshark.

Usually you see a lot of data in Wireshark. However are are only interested on POST data.

Why POST only?

Because when you type in your username, password and press the Login button, it generates a a POSTmethod (in short – you’re sending data to the remote server).

To filter all traffic and locate POST data, type in the following in the filter section

http.request.method == “POST”

See screenshot below. It is showing 1 POST event.

Website Password hacking using WireShark - blackMORE Ops - 3

Step 3: Analyze POST data for username and password

Now right click on that line and select Follow TCP Steam

Website Password hacking using WireShark - blackMORE Ops - 4

This will open a new Window that contains something like this:

HTTP/1.1 302 Found 
Date: Mon, 10 Nov 2014 23:52:21 GMT 
Server: Apache/2.2.15 (CentOS) 
X-Powered-By: PHP/5.3.3 
P3P: CP="NOI ADM DEV PSAi COM NAV OUR OTRo STP IND DEM" 
Set-Cookie: non=non; expires=Thu, 07-Nov-2024 23:52:21 GMT; path=/ 
Set-Cookie: password=e4b7c855be6e3d4307b8d6ba4cd4ab91; expires=Thu, 07-Nov-2024 23:52:21 GMT; path=/ 
Set-Cookie: scifuser=sampleuser; expires=Thu, 07-Nov-2024 23:52:21 GMT; path=/ 
Location: loggedin.php 
Content-Length: 0 
Connection: close 
Content-Type: text/html; charset=UTF-8

I’ve highlighted the user name and password field.

So in this case,

  1. username: sampleuser
  2. password: e4b7c855be6e3d4307b8d6ba4cd4ab91

But hang on, e4b7c855be6e3d4307b8d6ba4cd4ab91 can’t be a real password. It must be a hash value.

Note that some website’s doesn’t hash password’s at all even during sign on. For those, you’ve already got the username and password. In this case, let’s go bit far and identify this hash value

Step 4: Identify hash type

I will use hash-identifier to find out which type of hash is that. Open terminal and type in hash-identifier and paste the hash value. hash-identifier will give you possible matches.

See screenshot below:

Website Password hacking using WireShark - blackMORE Ops - 6

Now one thing for sure, we know it’s not a Domain Cached Credential. So it must be a MD5 hash value.

I can crack that using hashcat or cudahashcat.

Step 5: Cracking MD5 hashed password

I can easily crack this simple password using hashcat or similar softwares.

root@kali:~# hashcat -m 0 -a 0 /root/wireshark-hash.lf /root/rockyou.txt
(or)
root@kali:~# cudahashcat -m 0 -a 0 /root/wireshark-hash.lf /root/rockyou.txt
(or)
root@kali:~# cudahashcat32 -m 0 -a 0 /root/wireshark-hash.lf /root/rockyou.txt
(or)
root@kali:~# cudahashcat64 -m 0 -a 0 /root/wireshark-hash.lf /root/rockyou.txt

Because this was a simple password that existed in my password list, hashcat cracked it very easily.

Cracking password hashes

Website Password hacking using WireShark - blackMORE Ops - 7

Out final outcome looks like this:

  1. username: sampleuser
  2. password: e4b7c855be6e3d4307b8d6ba4cd4ab91:simplepassword

Conclusion

Well, to be honest it’s not possible for every website owner to implement SSL to secure password, some SSL’s cost you upto 1500$ per URL (well, you can get 10$ ones too but I personally never used those so I can’t really comment). But the least website owners (public ones where anyone can register) should do is to implement hashing during login-procedures. In that way, at least the password is hashed and that adds one more hurdle for someone from hacking website password easily. Actually it’s a big one as SSL encryption (theoretically) can take 100+years even with the best SuperComputer of today.

Enjoy and use this guide responsibly. Please Share and RT. Thanks.

Forensic Memory Analysis And Techniques For Windows, Linux And Mac OS


ABSTRACT
Due to the increased number of cases of cyber-crimes and intrusions, along with the storage capacity of hard disks and devices, it was necessary to extend the techniques of computer forensics, currently works consist in collection and analysis of static data stored hard drives, seeking to acquire evidence related to the occurrence of malicious activities in computer systems after its occurrence.
With the evolution of technological resources and the popularity of the Internet, it has become impractical to maintain only the traditional approach, due to the large volume of information to be analyzed and the growth of digital attacks. In this context, the analysis of data stored in volatile memory comes up with new techniques, it is necessary to check the processes that were running, established connections, or even access keys encrypted volumes, without causing the loss of sensitive information to the investigation, thus allowing the recovery of important data to the computer forensics.

Concept
Memory forensics is a promising technique that involves the process of capturing and analyzing data stored in volatile memory. Since, by volatile memory, which means that data can be lost on system shutdown, or can be rewritten in the normal functioning of the same. This characteristic of constant flux, the data in memory are usually less structured and predictable.

Data contained in the memory
The overview of the information stored in memory, everything is running on a computer is stored temporarily in memory, either in volatile memory, the paging file is related to virtual memory. By extracting an image of memory known as ‘dump’ memory is possible to identify the relationship of the running processes, it is possible to establish a relationship between the processes in order to identify which processes have started other processes, likewise, is feasible to identify which files, libraries, registry keys and sockets that were in use by each process. In summary, it is possible to map how the system was being used when generating the ‘dump’ memory and also recover executable programs stored in memory.

More information about “Dumps”
This is the method currently used by the experts in computer forensics to acquire the contents of RAM.
There are several programs that help the image acquisition memory system, this work. These tools make reading memory bit-by-bit and copy its contents to a file, the “dump” of memory. This file will have the same physical memory size of the system.
What should be taken into account, regardless of the tool being used, is that, as shown by the “Locard Exchange Principle”, when an acquisition program dump is executed, it must be loaded into memory, meaning it will traces, and that some of the memory space that could contain valuable information will be used, and can even lead to changes in the area occupied by processes to paging files. Furthermore, while the tool is reading the contents of the memory, the status of the system is not frozen, which means that while some pages are being copied, and others may be changed if the process is that use is still running, for example. What will define the time spent to collect the image are factors such as processor speed, bus fees and operations in and out of the disc.

Creating “Forensic Image” with FTK Imager

 
INTRODUCTION
FTK Imager is a free tool provided by Access to Data acquiring forensic images. The tool allows you to create, mainly disk images…Besides creating forensic disk images, we can perform memory dumps and even perform a forensic analysis on the small image created. There are many other fucionalidades you will discover when you are working with it. The FTK Imager was created by the company AccessData and is free.

STEP TO STEP
Well, I’m looking for a simple and practical way to demonstrate these concepts. Let’s click on the “File” menu and click the “Create Disk Image” and choose which disk or partition, or we will make the image. To choose the option to perform a forensic image of the disc, we will on the “Physical Drive”, if we want to make the image of a partition, let the option “Logical Drive”. Look the pictures below:

Figure 1) FTK Imager.

Figure 2) Logical Drive.

Figure 3) Physical Drive.

Then I’ll do the forensic image of a USB stick plugged into my machine, and also choose the option “Physical Drive “. Can I choose which device I want to make the image and then I click on the “Finish” button.

Figure 4) Select Drive.

Now click on “checkbox Verify images after area They created”. With this option selected, the tool will calculate the “hash” MD5 and SHA1 image created after that, click the “ADD” button.

Figure 5) Create Image.

Let’s select “RAW”, to perform forensic image format which is the tool of “DD” and click “Next”.

Figure 6) Select RAW.

Will request some information on evidência. We can fill these information . After that, click on “Next”.

Figure 7) Evidence Item Information.

Figure 8) Select Image Destination.

We will choose the output directory (where the forensic image is saved). “Image Filename” is where you must enter the filename of my image. In the “Image Fragment Size” I can put zero because I do not want my fragmented image. If I wanted to break into pieces, I put this field size in MB that every piece of my image would have. After that , just click on the “Finish” button.

Figure 9) The output directory.

Just click on the “Start” button.

Figure 10) Create Image.

Figure 11) Image Sumary.

When the process of image acquisition forensics has finished , we can display a summary with various information.
In the same directory where the image was stored was created a “txt”, which is like a log , which has the same summary information.

Extraction of digital artifacts with Volatility:
INTRODUCTION
Volatility is a completely open collection of tools, implemented in Python under the GNU General Public License, for the extraction of samples of digital artifacts from volatile memory (RAM).

STEP TO STEP
The tool supports a variety of formats “dump”, performs some automatic conversion between formats and can be used on any platform that supports Python. Installation and use are simple, simply unzip the package supplied by Systems Volatility in a system where Python already installed.
C:\Volatility>python volatility

Figure 1) Supported Internel Comands.
Example: volatility pslist -f /path/to/my/file

Figure 2) Use the command volatility
The image 3 shows the use of the command “ident”, which can be used to identify the date and time the image was collected, as well as providing information about the operating system on which the dump was generated:
C:\Volatility>python volatility ident –f C:\memorytest_rafael_fontes.dmp

Figure 3) Command ident.
You can use the –help option with any command to get help:
C:\Volatility>python volatility ident –-help

Figure 4) Option Volatility help tool.

To list the processes that were running at the time it was generated dump can use the “pslist.” As can be seen below, the output will contain the name of the process, its identifier (Pid) and father process ID (PPID) beyond the time when it was started and other useful information.
C:\Volatility>python volatility pslist –f C:\memorytest_rafael_fontes.dmp

Figure 5) Use the command pslist.

The “connscan” provides information about the network connections that were active at the time the data were collected memory. Already the “sockets” displays the open sockets at the time the dump was generated. The command “files” displays open files for each process. You can specify the case number on the command line to display only those files opened by a particular process.
C:\Volatility>python volatility files –p 1740 –f C:\ memorytest_rafael_fontes.dmp

Figure 6) Use the command files.

The command “dlllist” displays a list of DLLs loaded for each process, and the command “regobjkeys” displays a list of registry keys opened by each process.
C:\Volatility>python volatility dlllist –p 1740 –f C:\memorytest_rafael_fontes.dmp

Figure 7) Use the command dlllist
C:\Volatility>python volatility regobjkeys –p 1740 –f C:\memorytest_rafael_fontes.dmp

Figure 8) Use the command regobjkeys.

It is possible, through command “procdump” extracting executable from the dump of memory, allowing access to the code that was running on the machine, and thus better understand their behavior.
C:\Volatility>python volatility procdump –p 1740 –f C:\ memorytest_rafael_fontes.dmp

Figure 9) Use the command procdump.
It was possible to observe the generation of executable “executable.1740.exe” and the occurrence of informational messages like “Memory Not Accesible” after using the command “ProcDump”. This is because not all the virtual memory addresses are accessible on the image because it may have been, for example, paged to disk. Thus, these messages provide an audit log so that you can determine which parts of the executable generated were successfully retrieved.

Practical examples,to determine the date and time of the image, for example, one can use the following command:

>> Python volatility datetime -f target-2013-10-10.img
Image Local date and time: Mon Oct 10 16:20:12 2013
The command pslist, in turn, determines the procedures that were running at the time the image was captured:

>> Python volatility pslist -f target-2013-10-10.img
Name Pid PPID THDs HNDs Time
lsass.exe 536 480 20 369 Mon Oct 10 16:22:18 2013
To determine which system ports were open, one can employ the command “socks”. For the system under analysis, it is possible to detect, for example, the process LSASS.exe listening on port 4500.
>> Python volatility sockets -f target-2013-10-10.img

Forensic Memory for Linux distributions:    

S.M.A.R.T Linux  http://smartlinux.sourceforge.net/

Figure 1) S.M.AR.T. Linux.
S.M.A.R.T. Linux is a bootable floppy distribution containing tool (smartmontools) for monitoring IDE/SCSI hard disks (using Self-Monitoring, Analysis and Reporting Technology). Why floppy? Probably because all other distributions containing this useful utility are CD versions [and not everybody has a CD-ROM ;)]. It’s going to be free, small, helpful and easy to use. Current version is based on Kernel 2.4.26, uClibc 0.9.24 and BusyBox 1.00 official release. Built on Slackware 10.0.

The Sleuth Kit and Autopsy: http://www.sleuthkit.org/

Autopsy™ and The Sleuth Kit™ are open source digital investigation tools (a.k.a. digital forensic tools) that run on Windows, Linux, OS X, and other Unix systems. They can be used to analyze disk images and perform in-depth analysis of file systems (such as NTFS, FAT, HFS+, Ext3, and UFS) and several volume system types.

CAINE (Computer Aided Investigative Environment)
http://www.caine-live.net/

Figure 4) C.A.I.N.E.
CAINE(Italian GNU/Linux live distribution created as a project of Digital Forensics) offers a complete forensic environment that is organized to integrate existing software tools as software modules and to provide a friendly graphical interface.
The main design objectives that CAINE aims to guarantee are the following:
• An interoperable environment that supports the digital investigator during the four phases of the digital investigation.
• A user friendly graphical interface.
• A semi-automated compilation of the final report.

For MAC OS X
Below are some tools that can be used for forensic analysis on computers with Mac OS X.

Mac OS X Forensics Imager
http://www.appleexaminer.com/Utils/Downloads.html

Figure 1) Mac OS X Forensics Imager.
Tool for imaging disk byte by byte format Encase or FTK for later forensic analysis in these tools.

Metadata Extractor
Application to extract meta-data files for a specific folder in Mac Displays location on google maps in case there are geo-location information in the file.

File Juicer
http://echoone.com/filejuicer/

Figure 2) File Juicer 1.

 Figure 3) File Juicer 2.

Commercial software that enables the extraction of images and texts from any file. Ignores format, and scans files byte by byte for identifying the data supported. Among other features, there are the following, which find application in forensic analysis:

•    Extract images from PowerPoint presentations and PDFs
•    Recover deleted pictures and videos from memory cards
•    Recover text from corrupt
•    Extract images and html files from the cache of Safari
•    Extract attachments from email archives
•    Generate Word document from simple PDFs
•    Recover photos from iPods in TIFF
•    Convert ZIP files which are in. EXE
•    Extract JPEG images in RAW format (Canon & Nikon)
•    Extracting data from different types of cache file
•    Find and extract file in general data in JPEG, JP2, PNG, GIF, PDF, BMP, WMF, EMF, PICT, TIFF, Flash, Zip, HTML, WAV, MP3, AVI, MOV, MPG, WMV, MP4, AU, AIFF or text.

CONCLUSION
There are several trends that are revolutionizing the Forensic Memory. The process to do the analysis in memory forensics also walks for a better solution and refinement of the technique, it is an approach increasingly relevant in the context of Computer Forensics. In certain cases the popularity and use of tools for encrypting volumes as TrueCrypt, or creating malware residing only in volatile memory, raise the difficulty of analyzing the data stored in these devices.
However, it is interesting to note that the Forensic Memory is best seen as a complement to other approaches. An example of this is the procedure in which an investigation after the image capture of volatile memory, it uses the “Analysis of Living Systems” as a way to determine the next step in solving the case. Later, in the laboratory, we use the “Memory Forensics” as a complement to traditional forensics, giving greater agility and precision to the process.
I hope my article has helped computational experts and specialists in information security.

Volatility – An Advanced Open Source Memory Forensics Framework


Quick Start

  • Choose a release – the most recent is Volatility 2.4, released August 2014. Older versions are also available on the Releases page or respective release pages. If you want the cutting edge development build, use a git client and clone the master.
  • Install the code – Volatility is packaged in several formats, including source code in zip or tar archive (all platforms), a Pyinstaller executable (Windows only) and a standalone executable (Windows only). For help deciding which format is best for your needs, and for installation or upgrade instructions, see Installation.
  • Target OS specific setup – the Linux, Mac, and Andoid support may require accessing symbols and building your own profiles before using Volatility. If you plan to analyze these operating systems, please see Linux, Mac, or Android.
  • Read usage and plugins – command-line parameters, options, and plugins may differ between releases. For the most recent information, see Volatility Usage and Command Reference.
  • Communicate – If you have documentation, patches, ideas, or bug reports, you can communicate them through the github interface, IRC (#volatility on freenode), the Volatility Mailing List or Twitter (@volatility).
  • Develop – For advanced users who want to develop their own plugins, address spaces, and other components of volatility, there is a recommended StyleGuide.

Why Volatility

  • A single, cohesive framework analyzes RAM dumps from 32- and 64-bit windows, linux, mac, and android systems. Volatility’s modular design allows it to easily support new operating systems and architectures as they are released. All your devices are targets…so don’t limit your forensic capabilities to just windows computers.

  • Its Open Source GPLv2, which means you can read it, learn from it, and extend it. Why use a tool that outputs results without giving you any indication where the values came from or how they were interpreted? Learn how your tools work, understand why and how to tweak and enhance them – help yourself become a smarter analyst. You can also immediately fix any issues you discover, instead of having to wait weeks or months for vendors to communicate, reproduce, and publish patches.
  • Its written in Python, an established forensic and reverse engineering language with loads of libraries that can easily integrate into volatility. Most analysts are already familiar with Python and don’t want to learn new languages. For example, windbg’s scripting syntax which is often seen as cryptic and many times the capabilities just aren’t there. Other memory analysis frameworks require you to use Visual Studio to compile C# DLLs and the rest don’t expose a programming API at all.
  • Runs on windows, linux, or mac analysis systems (anywhere Python runs) – a refreshing break from other memory analysis tools that only run on windows and require .NET installations and admin privileges just to open. If you’re already accustomed to performing forensics on a particular host OS, by all means keep using it – and take volatility with you.
  • Extensible and scriptable API gives you the power to go beyond and continue innovating. For example you can use volatility to build a customized web interface or GUI, drive your malware sandbox, perform virtual machine introspection or just explore kernel memory in an automated fashion. Analysts can add new address spaces, plugins, data structures, and overlays to truly weld the framework to their needs. You can explore the Doxygen documentation for Volatility to get an idea of its internals.
  • Unparalleled feature sets based on reverse engineering and specialized research. Volatility provides capabilities that Microsoft’s own kernel debugger doesn’t allow, such as carving command histories, console input/output buffers, USER objects (GUI memory), and network related data structures. Just because its not documented doesn’t mean you can’t analyze it!
  • Comprehensive coverage of file formats – volatility can analyze raw dumps, crash dumps, hibernation files, VMware .vmem, VMware saved state and suspended files (.vmss/.vmsn), VirtualBox core dumps, LiME (Linux Memory Extractor), expert witness (EWF), and direct physical memory over Firewire. You can even convert back and forth between these formats. In the heat of your incident response moment, don’t get caught looking like a fool when someone hands you a format your other tools can’t parse.
  • Fast and efficient algorithms let you analyze RAM dumps from large systems without unnecessary overhead or memory consumption. For example volatility is able to list kernel modules from an 80 GB system in just a few seconds. There is always room for improvement, and timing differs per command, however other memory analysis frameworks can take several hours to do the same thing on much smaller memory dumps.
  • Serious and powerful community of practitioners and researchers who work in the forensics, IR, and malware analysis fields. It brings together contributors from commercial companies, law enforcement, and academic institutions around the world. Don’t just take our word for it – check out the Volatility Documentation Project – a collection of over 200 docs from 60+ different authors. Volatility is also being built on by a number of large organizations such as Google, National DoD Laboratories, DC3, and many Antivirus and security shops.
  • Forensics/IR/malware focus – Volatility was designed by forensics, incident response, and malware experts to focus on the types of tasks these analysts typically form. As a result, there are things that are often very important to a forensics analysts that are not as important to a person debugging a kernel driver (unallocated storage, indirect artifacts, etc).
  • Money-back guarantee – although volatility is free, we stand by our work. There is nothing another memory analysis framework can do that volatility can’t (or that it can’t be quickly programmed to do).

More information can be found at the following websites: https://github.com/volatilityfoundation/volatility, https://github.com/volatilityfoundation/volatility/wiki and http://www.volatilityfoundation.org

Evolve – An Python Based Web Interface For Memory Forensics Framework Volatility


Web interface for the Volatility Memory Forensics Framework https://github.com/volatilityfoundation/volatility

Current Version: 1.2 (2015-05-07)

Short video demo: https://youtu.be/55G2oGPQHF8 Pre-Scan video: https://youtu.be/mqMuQQowqMI

Installation

This requires volatility to be a library, not just an EXE file sitting somewhere. Run these commands at python shell:

Download Volatility source zip from https://github.com/volatilityfoundation/volatility
Inside the extracted folder run:
setup.py install

Then install these dependencies:
pip install bottle
pip install yara
pip install distorm3

  • Note: you may need to prefix sudo on the above commands depending on your OS.
  • Note: You may also need to prefix python if it is not in your run path.
  • Note: Windows may require distorm3 download: https://pypi.python.org/pypi/distorm3/3.3.0

Usage

-f File containing the RAM dump to analyze
-p Volatility profile to use during analysis
-d Optional path for output file. Default is beside memory image
-r comma separated list of plugins to run at the start

!!! WARNING: Avoid writing sqlite to NFS shares. They can lock or get corrupt. If you must, try mounting share with ‘nolock’ option.

Features

  • Works with any Volatility module that provides a SQLite render method (some don’t)
  • Automatically detects plugins – If volatility sees the plugin, so will eVOLve
  • All results stored in a single SQLite db stored beside the RAM dump
  • Web interface is fully AJAX using jQuery & JSON to pass requests and responses
  • Uses Bottle module in Python to provide a standalone web server
  • Option to edit SQL query to provide enhanced data views with data from multiple tables
  • Run plugins and view data from any browser – even a tablet!
  • Allow multiple people to review results of single RAM dump
  • Multiprocessing for full CPU usage
  • Pre-Scan runs a list of plugins at the start

Coming Features

  • Save custom queries for future use
  • Import/Export queries to share with others
  • Threading for more responsive interface while modules are running
  • Export/save of table data to JSON, CSV, etc
  • Review mode which requires only the generated SQLite file for better portability

Please send your ideas for features!

Release notes:
v1.0 – Initial release
v1.1 – Threading, Output folder option, removed unused imports
v1.2 – Pre-Scan option to run list of plugins at the start


More information can be found at: https://github.com/JamesHabben/evolve

SANS Digital Forensics Webcasts


Volatility Framework – Volatile memory extraction utility framework


============================================================================
Volatility Framework - Volatile memory extraction utility framework
============================================================================

The Volatility Framework is a completely open collection of tools,
implemented in Python under the GNU General Public License, for the
extraction of digital artifacts from volatile memory (RAM) samples.
The extraction techniques are performed completely independent of the
system being investigated but offer visibilty into the runtime state
of the system. The framework is intended to introduce people to the
techniques and complexities associated with extracting digital artifacts
from volatile memory samples and provide a platform for further work into
this exciting area of research.

The Volatility distribution is available from: 
http://www.volatilityfoundation.org/#!releases/component_71401

Volatility should run on any platform that supports 
Python (http://www.python.org)

Volatility supports investigations of the following memory images:

Windows:
* 32-bit Windows XP Service Pack 2 and 3
* 32-bit Windows 2003 Server Service Pack 0, 1, 2
* 32-bit Windows Vista Service Pack 0, 1, 2
* 32-bit Windows 2008 Server Service Pack 1, 2 (there is no SP0)
* 32-bit Windows 7 Service Pack 0, 1
* 32-bit Windows 8 and 8.1
* 64-bit Windows XP Service Pack 1 and 2 (there is no SP0)
* 64-bit Windows 2003 Server Service Pack 1 and 2 (there is no SP0)
* 64-bit Windows Vista Service Pack 0, 1, 2
* 64-bit Windows 2008 Server Service Pack 1 and 2 (there is no SP0)
* 64-bit Windows 2008 R2 Server Service Pack 0 and 1
* 64-bit Windows 7 Service Pack 0 and 1
* 64-bit Windows 8 and 8.1 
* 64-bit Windows Server 2012 and 2012 R2 

Linux: 
* 32-bit Linux kernels 2.6.11 to 3.5
* 64-bit Linux kernels 2.6.11 to 3.5
* OpenSuSE, Ubuntu, Debian, CentOS, Fedora, Mandriva, etc

Mac OSX:
* 32-bit 10.5.x Leopard (the only 64-bit 10.5 is Server, which isn't supported)
* 32-bit 10.6.x Snow Leopard
* 64-bit 10.6.x Snow Leopard
* 32-bit 10.7.x Lion
* 64-bit 10.7.x Lion
* 64-bit 10.8.x Mountain Lion (there is no 32-bit version)
* 64-bit 10.9.x Mavericks (there is no 32-bit version)

Volatility does not provide memory sample acquisition
capabilities. For acquisition, there are both free and commercial
solutions available. If you would like suggestions about suitable 
acquisition solutions, please contact us at:

volatility (at) volatilityfoundation (dot) org

Volatility supports a variety of sample file formats and the
ability to convert between these formats:

  - Raw linear sample (dd)
  - Hibernation file
  - Crash dump file
  - VirtualBox ELF64 core dump
  - VMware saved state and snapshot files
  - EWF format (E01) 
  - LiME (Linux Memory Extractor) format
  - Mach-o file format 
  - QEMU virtual machine dumps
  - Firewire 
  - HPAK (FDPro)

For a more detailed list of capabilities, see the following:

    https://github.com/volatilityfoundation/volatility/wiki

Example Data
============

If you want to give Volatility a try, you can download exemplar
memory images from the following url:

    https://github.com/volatilityfoundation/volatility/wiki/Memory-Samples

Mailing Lists
=============

Mailing lists to support the users and developers of Volatility
can be found at the following address:

    http://lists.volatilesystems.com/mailman/listinfo

Contact
=======
For information or requests, contact:

Volatility Foundation

Web: http://www.volatilityfoundation.org
     http://volatility-labs.blogspot.com
     http://volatility.tumblr.com
     
Email: volatility (at) volatilityfoundation (dot) org

IRC: #volatility on freenode

Twitter: @volatility 

Requirements
============
- Python 2.6 or later, but not 3.0. http://www.python.org

Some plugins may have other requirements which can be found at: 
    https://github.com/volatilityfoundation/volatility/wiki/Installation

Quick Start
===========
1. Unpack the latest version of Volatility from
    volatilityfoundation.org
   
2. To see available options, run "python vol.py -h" or "python vol.py --info"

   Example:

$ python vol.py --info
Volatility Foundation Volatility Framework 2.4
Usage: Volatility - A memory forensics analysis platform.

Profiles
--------
VistaSP0x64                - A Profile for Windows Vista SP0 x64
VistaSP0x86                - A Profile for Windows Vista SP0 x86
VistaSP1x64                - A Profile for Windows Vista SP1 x64
VistaSP1x86                - A Profile for Windows Vista SP1 x86
VistaSP2x64                - A Profile for Windows Vista SP2 x64
VistaSP2x86                - A Profile for Windows Vista SP2 x86
Win2003SP0x86              - A Profile for Windows 2003 SP0 x86
Win2003SP1x64              - A Profile for Windows 2003 SP1 x64
Win2003SP1x86              - A Profile for Windows 2003 SP1 x86
Win2003SP2x64              - A Profile for Windows 2003 SP2 x64
Win2003SP2x86              - A Profile for Windows 2003 SP2 x86
Win2008R2SP0x64            - A Profile for Windows 2008 R2 SP0 x64
Win2008R2SP1x64            - A Profile for Windows 2008 R2 SP1 x64
Win2008SP1x64              - A Profile for Windows 2008 SP1 x64
Win2008SP1x86              - A Profile for Windows 2008 SP1 x86
Win2008SP2x64              - A Profile for Windows 2008 SP2 x64
Win2008SP2x86              - A Profile for Windows 2008 SP2 x86
Win2012R2x64               - A Profile for Windows Server 2012 R2 x64
Win2012x64                 - A Profile for Windows Server 2012 x64
Win7SP0x64                 - A Profile for Windows 7 SP0 x64
Win7SP0x86                 - A Profile for Windows 7 SP0 x86
Win7SP1x64                 - A Profile for Windows 7 SP1 x64
Win7SP1x86                 - A Profile for Windows 7 SP1 x86
Win8SP0x64                 - A Profile for Windows 8 x64
Win8SP0x86                 - A Profile for Windows 8 x86
Win8SP1x64                 - A Profile for Windows 8.1 x64
Win8SP1x86                 - A Profile for Windows 8.1 x86
WinXPSP1x64                - A Profile for Windows XP SP1 x64
WinXPSP2x64                - A Profile for Windows XP SP2 x64
WinXPSP2x86                - A Profile for Windows XP SP2 x86
WinXPSP3x86                - A Profile for Windows XP SP3 x86

Address Spaces
--------------
AMD64PagedMemory              - Standard AMD 64-bit address space.
ArmAddressSpace               - No docs        
FileAddressSpace              - This is a direct file AS.
HPAKAddressSpace              - This AS supports the HPAK format
IA32PagedMemory               - Standard IA-32 paging address space.
IA32PagedMemoryPae            - This class implements the IA-32 PAE paging address space. It is responsible
LimeAddressSpace              - Address space for Lime
MachOAddressSpace             - Address space for mach-o files to support atc-ny memory reader
OSXPmemELF                    - This AS supports VirtualBox ELF64 coredump format
QemuCoreDumpElf               - This AS supports Qemu ELF32 and ELF64 coredump format
VMWareAddressSpace            - This AS supports VMware snapshot (VMSS) and saved state (VMSS) files
VMWareMetaAddressSpace        - This AS supports the VMEM format with VMSN/VMSS metadata
VirtualBoxCoreDumpElf64       - This AS supports VirtualBox ELF64 coredump format
WindowsCrashDumpSpace32       - This AS supports windows Crash Dump format
WindowsCrashDumpSpace64       - This AS supports windows Crash Dump format
WindowsCrashDumpSpace64BitMap - This AS supports Windows BitMap Crash Dump format
WindowsHiberFileSpace32       - This is a hibernate address space for windows hibernation files.

Plugins
-------
apihooks                   - Detect API hooks in process and kernel memory
atoms                      - Print session and window station atom tables
atomscan                   - Pool scanner for atom tables
auditpol                   - Prints out the Audit Policies from HKLM\SECURITY\Policy\PolAdtEv
bigpools                   - Dump the big page pools using BigPagePoolScanner
bioskbd                    - Reads the keyboard buffer from Real Mode memory
cachedump                  - Dumps cached domain hashes from memory
callbacks                  - Print system-wide notification routines
clipboard                  - Extract the contents of the windows clipboard
cmdline                    - Display process command-line arguments
cmdscan                    - Extract command history by scanning for _COMMAND_HISTORY
connections                - Print list of open connections [Windows XP and 2003 Only]
connscan                   - Pool scanner for tcp connections
consoles                   - Extract command history by scanning for _CONSOLE_INFORMATION
crashinfo                  - Dump crash-dump information
deskscan                   - Poolscaner for tagDESKTOP (desktops)
devicetree                 - Show device tree
dlldump                    - Dump DLLs from a process address space
dlllist                    - Print list of loaded dlls for each process
driverirp                  - Driver IRP hook detection
driverscan                 - Pool scanner for driver objects
dumpcerts                  - Dump RSA private and public SSL keys
dumpfiles                  - Extract memory mapped and cached files
envars                     - Display process environment variables
eventhooks                 - Print details on windows event hooks
evtlogs                    - Extract Windows Event Logs (XP/2003 only)
filescan                   - Pool scanner for file objects
gahti                      - Dump the USER handle type information
gditimers                  - Print installed GDI timers and callbacks
gdt                        - Display Global Descriptor Table
getservicesids             - Get the names of services in the Registry and return Calculated SID
getsids                    - Print the SIDs owning each process
handles                    - Print list of open handles for each process
hashdump                   - Dumps passwords hashes (LM/NTLM) from memory
hibinfo                    - Dump hibernation file information
hivedump                   - Prints out a hive
hivelist                   - Print list of registry hives.
hivescan                   - Pool scanner for registry hives
hpakextract                - Extract physical memory from an HPAK file
hpakinfo                   - Info on an HPAK file
idt                        - Display Interrupt Descriptor Table
iehistory                  - Reconstruct Internet Explorer cache / history
imagecopy                  - Copies a physical address space out as a raw DD image
imageinfo                  - Identify information for the image
impscan                    - Scan for calls to imported functions
joblinks                   - Print process job link information
kdbgscan                   - Search for and dump potential KDBG values
kpcrscan                   - Search for and dump potential KPCR values
ldrmodules                 - Detect unlinked DLLs
limeinfo                   - Dump Lime file format information
linux_apihooks             - Checks for userland apihooks
linux_arp                  - Print the ARP table
linux_banner               - Prints the Linux banner information
linux_bash                 - Recover bash history from bash process memory
linux_bash_env             - Recover bash's environment variables
linux_bash_hash            - Recover bash hash table from bash process memory
linux_check_afinfo         - Verifies the operation function pointers of network protocols
linux_check_creds          - Checks if any processes are sharing credential structures
linux_check_evt_arm        - Checks the Exception Vector Table to look for syscall table hooking
linux_check_fop            - Check file operation structures for rootkit modifications
linux_check_idt            - Checks if the IDT has been altered
linux_check_inline_kernel  - Check for inline kernel hooks
linux_check_modules        - Compares module list to sysfs info, if available
linux_check_syscall        - Checks if the system call table has been altered
linux_check_syscall_arm    - Checks if the system call table has been altered
linux_check_tty            - Checks tty devices for hooks
linux_cpuinfo              - Prints info about each active processor
linux_dentry_cache         - Gather files from the dentry cache
linux_dmesg                - Gather dmesg buffer
linux_dump_map             - Writes selected memory mappings to disk
linux_elfs                 - Find ELF binaries in process mappings
linux_enumerate_files      - Lists files referenced by the filesystem cache
linux_find_file            - Lists and recovers files from memory
linux_hidden_modules       - Carves memory to find hidden kernel modules
linux_ifconfig             - Gathers active interfaces
linux_info_regs            - It's like 'info registers' in GDB. It prints out all the
linux_iomem                - Provides output similar to /proc/iomem
linux_kernel_opened_files  - Lists files that are opened from within the kernel
linux_keyboard_notifiers   - Parses the keyboard notifier call chain
linux_ldrmodules           - Compares the output of proc maps with the list of libraries from libdl
linux_library_list         - Lists libraries loaded into a process
linux_librarydump          - Dumps shared libraries in process memory to disk
linux_list_raw             - List applications with promiscuous sockets
linux_lsmod                - Gather loaded kernel modules
linux_lsof                 - Lists open files
linux_malfind              - Looks for suspicious process mappings
linux_memmap               - Dumps the memory map for linux tasks
linux_moddump              - Extract loaded kernel modules
linux_mount                - Gather mounted fs/devices
linux_mount_cache          - Gather mounted fs/devices from kmem_cache
linux_netfilter            - Lists Netfilter hooks
linux_netstat              - Lists open sockets
linux_pidhashtable         - Enumerates processes through the PID hash table
linux_pkt_queues           - Writes per-process packet queues out to disk
linux_plthook              - Scan ELF binaries' PLT for hooks to non-NEEDED images
linux_proc_maps            - Gathers process maps for linux
linux_proc_maps_rb         - Gathers process maps for linux through the mappings red-black tree
linux_procdump             - Dumps a process's executable image to disk
linux_process_hollow       - Checks for signs of process hollowing
linux_psaux                - Gathers processes along with full command line and start time
linux_psenv                - Gathers processes along with their environment
linux_pslist               - Gather active tasks by walking the task_struct->task list
linux_pslist_cache         - Gather tasks from the kmem_cache
linux_pstree               - Shows the parent/child relationship between processes
linux_psxview              - Find hidden processes with various process listings
linux_recover_filesystem   - Recovers the entire cached file system from memory
linux_route_cache          - Recovers the routing cache from memory
linux_sk_buff_cache        - Recovers packets from the sk_buff kmem_cache
linux_slabinfo             - Mimics /proc/slabinfo on a running machine
linux_strings              - Match physical offsets to virtual addresses (may take a while, VERY verbose)
linux_threads              - Prints threads of processes
linux_tmpfs                - Recovers tmpfs filesystems from memory
linux_truecrypt_passphrase - Recovers cached Truecrypt passphrases
linux_vma_cache            - Gather VMAs from the vm_area_struct cache
linux_volshell             - Shell in the memory image
linux_yarascan             - A shell in the Linux memory image
lsadump                    - Dump (decrypted) LSA secrets from the registry
mac_adium                  - Lists Adium messages
mac_apihooks               - Checks for API hooks in processes
mac_apihooks_kernel        - Checks to see if system call and kernel functions are hooked
mac_arp                    - Prints the arp table
mac_bash                   - Recover bash history from bash process memory
mac_bash_env               - Recover bash's environment variables
mac_bash_hash              - Recover bash hash table from bash process memory
mac_calendar               - Gets calendar events from Calendar.app
mac_check_mig_table        - Lists entires in the kernel's MIG table
mac_check_syscall_shadow   - Looks for shadow system call tables
mac_check_syscalls         - Checks to see if system call table entries are hooked
mac_check_sysctl           - Checks for unknown sysctl handlers
mac_check_trap_table       - Checks to see if mach trap table entries are hooked
mac_contacts               - Gets contact names from Contacts.app
mac_dead_procs             - Prints terminated/de-allocated processes
mac_dead_sockets           - Prints terminated/de-allocated network sockets
mac_dead_vnodes            - Lists freed vnode structures
mac_dmesg                  - Prints the kernel debug buffer
mac_dump_file              - Dumps a specified file
mac_dump_maps              - Dumps memory ranges of processes
mac_dyld_maps              - Gets memory maps of processes from dyld data structures
mac_find_aslr_shift        - Find the ASLR shift value for 10.8+ images
mac_ifconfig               - Lists network interface information for all devices
mac_ip_filters             - Reports any hooked IP filters
mac_keychaindump           - Recovers possbile keychain keys. Use chainbreaker to open related keychain files
mac_ldrmodules             - Compares the output of proc maps with the list of libraries from libdl
mac_librarydump            - Dumps the executable of a process
mac_list_files             - Lists files in the file cache
mac_list_sessions          - Enumerates sessions
mac_list_zones             - Prints active zones
mac_lsmod                  - Lists loaded kernel modules
mac_lsmod_iokit            - Lists loaded kernel modules through IOkit
mac_lsmod_kext_map         - Lists loaded kernel modules
mac_lsof                   - Lists per-process opened files
mac_machine_info           - Prints machine information about the sample
mac_malfind                - Looks for suspicious process mappings
mac_memdump                - Dump addressable memory pages to a file
mac_moddump                - Writes the specified kernel extension to disk
mac_mount                  - Prints mounted device information
mac_netstat                - Lists active per-process network connections
mac_network_conns          - Lists network connections from kernel network structures
mac_notesapp               - Finds contents of Notes messages
mac_notifiers              - Detects rootkits that add hooks into I/O Kit (e.g. LogKext)
mac_pgrp_hash_table        - Walks the process group hash table
mac_pid_hash_table         - Walks the pid hash table
mac_print_boot_cmdline     - Prints kernel boot arguments
mac_proc_maps              - Gets memory maps of processes
mac_procdump               - Dumps the executable of a process
mac_psaux                  - Prints processes with arguments in user land (**argv)
mac_pslist                 - List Running Processes
mac_pstree                 - Show parent/child relationship of processes
mac_psxview                - Find hidden processes with various process listings
mac_recover_filesystem     - Recover the cached filesystem
mac_route                  - Prints the routing table
mac_socket_filters         - Reports socket filters
mac_strings                - Match physical offsets to virtual addresses (may take a while, VERY verbose)
mac_tasks                  - List Active Tasks
mac_trustedbsd             - Lists malicious trustedbsd policies
mac_version                - Prints the Mac version
mac_volshell               - Shell in the memory image
mac_yarascan               - Scan memory for yara signatures
machoinfo                  - Dump Mach-O file format information
malfind                    - Find hidden and injected code
mbrparser                  - Scans for and parses potential Master Boot Records (MBRs)
memdump                    - Dump the addressable memory for a process
memmap                     - Print the memory map
messagehooks               - List desktop and thread window message hooks
mftparser                  - Scans for and parses potential MFT entries
moddump                    - Dump a kernel driver to an executable file sample
modscan                    - Pool scanner for kernel modules
modules                    - Print list of loaded modules
multiscan                  - Scan for various objects at once
mutantscan                 - Pool scanner for mutex objects
netscan                    - Scan a Vista (or later) image for connections and sockets
notepad                    - List currently displayed notepad text
objtypescan                - Scan for Windows object type objects
patcher                    - Patches memory based on page scans
poolpeek                   - Configurable pool scanner plugin
pooltracker                - Show a summary of pool tag usage
printkey                   - Print a registry key, and its subkeys and values
privs                      - Display process privileges
procdump                   - Dump a process to an executable file sample
pslist                     - Print all running processes by following the EPROCESS lists
psscan                     - Pool scanner for process objects
pstree                     - Print process list as a tree
psxview                    - Find hidden processes with various process listings
raw2dmp                    - Converts a physical memory sample to a windbg crash dump
screenshot                 - Save a pseudo-screenshot based on GDI windows
sessions                   - List details on _MM_SESSION_SPACE (user logon sessions)
shellbags                  - Prints ShellBags info
shimcache                  - Parses the Application Compatibility Shim Cache registry key
sockets                    - Print list of open sockets
sockscan                   - Pool scanner for tcp socket objects
ssdt                       - Display SSDT entries
strings                    - Match physical offsets to virtual addresses (may take a while, VERY verbose)
svcscan                    - Scan for Windows services
symlinkscan                - Pool scanner for symlink objects
thrdscan                   - Pool scanner for thread objects
threads                    - Investigate _ETHREAD and _KTHREADs
timeliner                  - Creates a timeline from various artifacts in memory
timers                     - Print kernel timers and associated module DPCs
truecryptmaster            - Recover TrueCrypt 7.1a Master Keys
truecryptpassphrase        - TrueCrypt Cached Passphrase Finder
truecryptsummary           - TrueCrypt Summary
unloadedmodules            - Print list of unloaded modules
userassist                 - Print userassist registry keys and information
userhandles                - Dump the USER handle tables
vaddump                    - Dumps out the vad sections to a file
vadinfo                    - Dump the VAD info
vadtree                    - Walk the VAD tree and display in tree format
vadwalk                    - Walk the VAD tree
vboxinfo                   - Dump virtualbox information
verinfo                    - Prints out the version information from PE images
vmwareinfo                 - Dump VMware VMSS/VMSN information
volshell                   - Shell in the memory image
windows                    - Print Desktop Windows (verbose details)
wintree                    - Print Z-Order Desktop Windows Tree
wndscan                    - Pool scanner for window stations
yarascan                   - Scan process or kernel memory with Yara signatures

3. To get more information on a Windows memory sample and to make sure Volatility
   supports that sample type, run 'python vol.py imageinfo -f <imagename>' or 'python vol.py kdbgscan -f <imagename>'

   Example:
   
    $ python vol.py imageinfo -f WIN-II7VOJTUNGL-20120324-193051.raw 
    Volatility Foundation Volatility Framework 2.4
    Determining profile based on KDBG search...
    
              Suggested Profile(s) : Win2008R2SP0x64, Win7SP1x64, Win7SP0x64, Win2008R2SP1x64 (Instantiated with Win7SP0x64)
                         AS Layer1 : AMD64PagedMemory (Kernel AS)
                         AS Layer2 : FileAddressSpace (/Path/to/WIN-II7VOJTUNGL-20120324-193051.raw)
                          PAE type : PAE
                               DTB : 0x187000L
                              KDBG : 0xf800016460a0
              Number of Processors : 1
         Image Type (Service Pack) : 1
                    KPCR for CPU 0 : 0xfffff80001647d00L
                 KUSER_SHARED_DATA : 0xfffff78000000000L
               Image date and time : 2012-03-24 19:30:53 UTC+0000
         Image local date and time : 2012-03-25 03:30:53 +0800

4. Run some other plugins. -f is a required option for all plugins. Some
   also require/accept other options. Run "python vol.py <plugin> -h" for
   more information on a particular command.  A Command Reference wiki
   is also available on the Google Code site:

        https://github.com/volatilityfoundation/volatility/wiki

   as well as Basic Usage:

        https://github.com/volatilityfoundation/volatility/wiki/Volatility-Usage

Licensing and Copyright
=======================

Copyright (C) 2007-2014 Volatility Foundation

All Rights Reserved

Volatility is free software; you can redistribute it and/or modify
it under the terms of the GNU General Public License as published by
the Free Software Foundation; either version 2 of the License, or
(at your option) any later version.

Volatility is distributed in the hope that it will be useful,
but WITHOUT ANY WARRANTY; without even the implied warranty of
MERCHANTABILITY or FITNESS FOR A PARTICULAR PURPOSE.  See the
GNU General Public License for more details.

You should have received a copy of the GNU General Public License
along with Volatility.  If not, see <http://www.gnu.org/licenses/>.

Bugs and Support
================
There is no support provided with Volatility. There is NO
warranty; not even for MERCHANTABILITY or FITNESS FOR A PARTICULAR
PURPOSE. 

If you think you've found a bug, please report it at:

    https://github.com/volatilityfoundation/volatility/issues

In order to help us solve your issues as quickly as possible,
please include the following information when filing a bug:

* The version of volatility you're using
* The operating system used to run volatility
* The version of python used to run volatility
* The suspected operating system of the memory image
* The complete command line you used to run volatility

Depending on the operating system of the memory image, you may need to provide
additional information, such as:

For Windows:
* The suspected Service Pack of the memory image

For Linux:
* The suspected kernel version of the memory image

Other options for communicaton can be found at:
    https://github.com/volatilityfoundation/volatility/wiki

Missing or Truncated Information
================================
Volatility Foundation makes no claims about the validity or correctness of the
output of Volatility. Many factors may contribute to the
incorrectness of output from Volatility including, but not
limited to, malicious modifications to the operating system,
incomplete information due to swapping, and information corruption on
image acquisition. 

Command Reference 
====================
The following url contains a reference of all commands supported by 
Volatility.

    https://github.com/volatilityfoundation/volatility/wiki
====================


More Information can be found on:https://github.com/volatilityfoundation/volatility and on http://www.volatilityfoundation.org

SANS Forensics Whitepapers


White Papers are an excellent source for information gathering, problem-solving and learning. Below is a list of White Papers written by forensic practitioners seeking GCFA, GCFE, and GREM Gold. SANS attempts to ensure the accuracy of information, but papers are published “as is”.

Errors or inconsistencies may exist or may be introduced over time. If you suspect a serious error, please contact webmaster@sans.org.

SANS Forensics Whitepapers
Paper Author Cert
Intelligence-Driven Incident Response with YARA Ricardo Dias GCFA
Review of Windows 7 as a Malware Analysis Environment Adam Kramer GREM
Straddling the Next Frontier Part 2: How Quantum Computing has already begun impacting the Cyber Security landscape Eric Jodoin GCFA
Case Study: 2012 DC3 Digital Forensic Challenge Basic Malware Analysis Exercise Kenneth Zahn GREM
Detailed Analysis Of Sykipot (Smartcard Proxy Variant) Rong Hwa Chong GREM
Windows ShellBag Forensics in Depth Vincent Lo GCFA
A Detailed Analysis of an Advanced Persistent Threat Malware Frankie Fu Kay Li GREM
Forensic Images: For Your Viewing Pleasure Sally Vandeven GCFA
Analyzing Man-in-the-Browser (MITB) Attacks Chris Cain GCFA
Using IOC (Indicators of Compromise) in Malware Forensics Hun Ya Lock GREM
A Journey into Litecoin Forensic Artifacts Daniel Piggott GCFA
MalwareD: A study on network and host based defenses that prevent malware from accomplishing its goals Dave Walters GREM
Clash of the Titans: ZeuS v SpyEye Harshit Nayyar GREM
An Opportunity In Crisis Harshit Nayyar GREM
Comprehensive Blended Malware Threat Dissection Analyze Fake Anti-Virus Software and PDF Payloads Anthony Cheuk Tung Lai GREM
Creating a Baseline of Process Activity for Memory Forensics Gordon Fraser GCFA
Automation of Report and Timeline-file based file and URL analysis Florian Eichelberger GCFA
Repurposing Network Tools to Inspect File Systems Andre Thibault GCFA
Enhancing incident response through forensic, memory analysis and malware sandboxing techniques Wylie Shanks GCFA
Using Sysmon to Enrich Security Onion’s Host-Level Capabilities Joshua Brower GCFA
Indicators of Compromise in Memory Forensics Chad Robertson GCFA
Forensicator FATE – From Artisan To Engineer Barry Anderson GCFA
Computer Forensic Timeline Analysis with Tapestry Derek Edwards GCFA
Windows Logon Forensics Sunil Gupta GCFA
What’s in a Name: Uncover the Meaning behind Windows Files and Processes Larisa Long GCFA
Analysis of a Simple HTTP Bot Daryl Ashley GREM
XtremeRAT – When Unicode Breaks Harri Sylvander GREM
Analysis of the building blocks and attack vectors associated with the Unified Extensible Firmware Interface (UEFI) Jean Agneessens GREM
Mobile Device Forensics Andrew Martin GCFA
Mac OS X Malware Analysis Joel Yonts GCFA
Building a Malware Zoo Joel Yonts GREM
Mastering the Super Timeline With log2timeline Kristinn Gudjonsson GCFA
A Regular Expression Search Primer for Forensic Analysts Timothy Cook GCFA
Identifying Malicious Code Infections Out of Network Ken Dunham GCFA
Live Response Using PowerShell Sajeev Nair GCFA
Forensic Analysis on iOS Devices Tim Proffitt GCFE
CC Terminals, Inc.Forensic Examination Report: Examination of a USB Hard Drive Brent Duckworth GCFA
Unspoken Truths – Forensic Analysis of an Unknown Binary Louie Velocci GCFA
Forensic Analysis of a SQL Server 2005 Database Server Kevvie Fowler GCFA
Taking advantage of Ext3 journaling file system in a forensic investigation Gregorio Narvaez GCFA
Lessons from a Linux Compromise John Ritchie GCFA
Forensic Analysis of a Compromised NT Server(Phishing) Andres Velazquez GCFA
Analysis of a serial based digital voice recorder Craig Wright GCFA
Analysis of an unknown USB JumpDrive image Roger Hiew GCFA
Forensic Investigation of USB Flashdrive Image for CC Terminals Rhonda Diggs GCFA
Discovering Winlogoff.exe Jennie Callahan GREM
GIAC GREM Assignment – Pass Joe Fresch GREM
Analysis of an unknown disk Jure Simsic GCFA
Integrating Forensic Investigation Methodology into eDiscovery Jeff Groman GCFA
Analysis of a Windows XP Professional compromised system Manuel Humberto Santander Pelaez GCFA
Analysis of a Commercial Keylogger installed on multiple systems Merlin Namuth GCFA
GIAC GREM Assignment – Pass David Chance GREM
Reverse Engineering the Microsoft exFAT File System Robert Shullich GCFA
How not to use a rootkit Mike Wilson GCFA
Forensic Analysis on a compromised Linux Web Server Jeri Malone GCFA
Analysis of a Red Hat Honeypot James Shewmaker GCFA
GIAC GREM Assignment – Pass James Shewmaker GREM
Forensic with Open-Source Tools and Platform: USB Flash Drive Image Forensic Analysis Leonard Ong GCFA
Forensic analysis of a Windows 2000 computer literacy training and software development device Golden Richard GCFA
GIAC GREM Assignment – Pass James Balcik GREM
Forensic Analysis Procedures of a Compromised system using Encase Jeffrey McGurk GCFA
Forensic analysis of a Compromised Windows 2000 workstation Charles Fraser GCFA
Forensic Analysis on a compromised Windows 2000 Honeypot Peter Hewitt GCFA
Evaluation of Crocwareis Mount Image Pro as a Forensic Tool Hugh Tower-Pierce GCFA
Forensic Tool Evaluation-MiTeC Registry File Viewer Kevin Fiscus GCFA
Camouflaged and Attacked? Bertha Marasky GCFA
Review of Foundstone Vision as a forensic tool Bil Bingham GCFA
Forensic Analysis of a Compromised Intranet Server Roberto Obialero GCFA
Analysis of an IRC-bot compromised Microsoft Windows system Jennifer Kolde GCFA
HONORS-Analysis of a USB Flashdrive Image Raul Siles GCFA
Safe at Home? David Perez GCFA
Evaluation of a Honeypot Windows 2000 Server with an IIS Web/FTP Server Kenneth Pearlstein GCFA
Forensic Analysis of a USB Flash Drive Norrie Bennie GCFA
Open Source Forensic Analysis – Windows 2000 Server – Andre Arnes GCFA
Forensic Analysis of dual bootable Operating System (OS) running a default Red Hat 6.2 Linux server installation and Windows 98 Mohd Shukri Othman GCFA
An Examination of a Compromised Solaris Honeypot, an Unknown Binary, and the Legal Issues Surrounding Incident Investigations Robert Mccauley GCFA
Forensic Analysis of an EBay acquired Drive Daniel Wesemann GCFA
Analyze an Unknown Image and Forensic Tool Validation: Sterilize Steven Becker GCFA
Malware Adventure Russell Elliott GREM
Binary Analysis, Forensics and Legal Issues Michael Wyman GCFA
Analysis on a compromised Linux RedHat 8.0 Honeypot Jeff Bryner GCFA
Forensic analysis of a compromised RedHat Linux 7.0 system Jake Cunningham GCFA
Validation of Norton Ghost 2003 John Brozycki GCFA
Forensic Analysis of Shared Workstation Michael Kerr GCFA
Forensic Analysis on a Windows 2000 Pro Workstation David Cragg GCFA
Sys Admins and Hackers/Analysis of a hacked system Lars Fresen GCFA
Validation of ISObuster v1.0 Steven Dietz GCFA
GIAC GREM Assignment – Pass Gregory Leibolt GREM
Analysis of a Potentially Misused Windows 95 System Gregory Leibolt GCFA
Forensic Analysis Think pad 600 laptop running Windows 2000 server Brad Bowers GCFA
Validation of Restorer 2000 Pro v1.1 (Build 110621) Denis Brooker GCFA
Analysis of a Suspect Red Hat Linux 6.1 System James Fung GCFA
Dead Linux Machines Do Tell Tales James Fung GCFA
Analysis and Comparison of Red Hat Linux 6.2 Honeypots With & Without LIDS-enabled Kernels Greg Owen GCFA
Analyzing a Binary File and File Partitions for Forensic Evidence James Butler GCFA
Becoming a Forensic Investigator/Use of Forensic Toolkit Mark Maher GCFA
Discovery Of A Rootkit: A simple scan leads to a complex solution John Melvin GCFA
GIAC GREM Assignment – Pass Lorna Hutcheson GREM
Forensic Analysis of a Windows 2000 server with IIS and Oracle Beth Binde GCFA
Forensic Analysis of a Sun Ultra System Tom Chmielarski GCFA
Reverse Engineering msrll.exe Rick Wanner GREM
Forensic Validity of Netcat Michael Worman GCFA
CC Terminals Harassment Case Dean Farrington GCFA
Forensic analysis of a compromised Linux RedHat 7.3 system Kevin Miller GCFA
Validation of Process Accounting Records Jim Clausing GCFA
Building an Automated Behavioral Malware Analysis Environment using Open Source Software Jim Clausing GREM
Forensic analysis of a Windows 98 system Jerry Shenk GCFA
Forensic analysis of a Compromised Red Hat 7.2 Web Server Martin Walker GCFA

from: http://digital-forensics.sans.org/community/whitepapers

SANS Investigative Forensic Toolkit (SIFT) Workstation Version 3


SANS Investigative Forensic Toolkit (SIFT) Workstation Version 3

Download SIFT Workstation VMware Appliance Now – 1.5 GB

Having trouble downloading?
If you are having trouble downloading the SIFT Kit please contact sift-support@sans.org and include the URL you were given, your IP address, browser type, and if you are using a proxy of any kind.

Having trouble with SIFT 3?
If you are experiencing errors in SIFT 3 itself, please submit errors, bugs, and recommended updates here: https://github.com/sans-dfir/sift/issues

How To:

  1. Download Ubuntu 14.04 ISO file and install Ubuntu 14.04 on any system. -> http://www.ubuntu.com/download/desktop
  2. Once installed, open a terminal and run “wget –quiet -O – https://raw.github.com/sans-dfir/sift-bootstrap/master/bootstrap.sh | sudo bash -s — -i -s -y”
  3. Congrats — you now have a SIFT workstation!!

Page Links

  • SIFT Workstation 3 Overview
  • Download SIFT Workstation 3 Locations
  • Manual SIFT 3 Installation
  • SIFT Workstation 3 Capabilities
  • SIFT Workstation 3 How-Tos
  • Report Bugs
  • SIFT Recommendations

SIFT Workstation 3 Overview

An international team of forensics experts, led by SANS Faculty Fellow Rob Lee, created the SANS Investigative Forensic Toolkit (SIFT) Workstation and made it available to the whole community as a public service. The free SIFT toolkit, that can match any modern forensic tool suite, is also featured in SANS’ Advanced Computer Forensic Analysis and Incident Response course (FOR 508). It demonstrates that advanced investigations and responding to intrusions can be accomplished using cutting-edge open-source tools that are freely available and frequently updated.

Offered free of charge, the SIFT 3 Workstation will debut during SANS’ Advanced Computer Forensic Analysis and Incident Response course (FOR508) at DFIRCON. SIFT 3 demonstrates that advanced investigations and responding to intrusions can be accomplished using cutting-edge open-source tools that are freely available and frequently updated.

“Even if SIFT were to cost tens of thousands of dollars, it would still be a very competitive product,” says, Alan Paller, director of research at SANS. “At no cost, there is no reason it should not be part of the portfolio in every organization that has skilled forensics analysts.”

Developed and continually updated by an international team of forensic experts, the SIFT is a group of free open-source forensic tools designed to perform detailed digital forensic examinations in a variety of settings. With over 100,000 downloads to date, the SIFT continues to be the most popular open-source forensic offering next to commercial source solutions.

“The SIFT Workstation has quickly become my “go to” tool when conducting an exam. The powerful open source forensic tools in the kit on top of the versatile and stable Linux operating system make for quick access to most everything I need to conduct a thorough analysis of a computer system,” said Ken Pryor, GCFA Robinson, IL Police Department

Key new features of SIFT 3 include:

  • Ubuntu LTS 14.04 Base
  • 64 bit base system
  • Better memory utilization
  • Auto-DFIR package update and customizations
  • Latest forensic tools and techniques
  • VMware Appliance ready to tackle forensics
  • Cross compatibility between Linux and Windows
  • Option to install stand-alone via (.iso) or use via VMware Player/Workstation
  • Online Documentation Project at http://sift.readthedocs.org/
  • Expanded Filesystem Support

Download SIFT Workstation 3 Locations

Download SIFT Workstation VMware Appliance – 1.5 GB

Note: The file is zipped using 7zip in the 7z format. We recommend 7zip to unzip it. Download 7zip.

Manual SIFT 3 Installation

Installation

We tried to make the installation (and upgrade) of the SIFT workstation as simple as possible, so we create the SIFT Bootstrap project, which is a shell script that can be downloaded and executed to convert your Ubuntu installation into a SIFT workstation.

Check the project out at https://github.com/sans-dfir/sift-bootstrap

Quickstart

Using wget to install the latest, configure SIFT, and SIFT theme

wget –quiet -O – https://raw.github.com/sans-dfir/sift-bootstrap/master/bootstrap.sh | sudo bash -s — -i -s -y

Using wget to install the latest (tools only)

wget –quiet -O – https://raw.github.com/sans-dfir/sift-bootstrap/master/bootstrap.sh | sudo bash -s — -i

SIFT Login/Password:

After downloading the toolkit, use the credentials below to gain access.

  • Login “sansforensics”
  • Password “forensics”
  • $ sudo su –
    • Use to elevate privileges to root while mounting disk images.

SIFT Workstation 3 Capabilities

Ability to securely examine raw disks, multiple file systems, evidence formats. Places strict guidelines on how evidence is examined (read-only) verifying that the evidence has not changed

File system support
  • ntfs (NTFS)
  • iso9660 (ISO9660 CD)
  • hfs (HFS+)
  • raw (Raw Data)
  • swap (Swap Space)
  • memory (RAM Data)
  • fat12 (FAT12)
  • fat16 (FAT16)
  • fat32 (FAT32)
  • ext2 (EXT2)
  • ext3 (EXT3)
  • ext4 (EXT4)
  • ufs1 (UFS1)
  • ufs2 (UFS2)
  • vmdk
Evidence Image Support
  • raw (Single raw file (dd))
  • aff (Advanced Forensic Format)
  • afd (AFF Multiple File)
  • afm (AFF with external metadata)
  • afflib (All AFFLIB image formats (including beta ones))
  • ewf (Expert Witness format (encase))
  • split raw (Split raw files) via affuse
  • affuse x2010 mount 001 image/split images to view single raw file and metadata
  • split ewf (Split E01 files) via mount_ewf.py
  • mount_ewf.py x2010 mount E01 image/split images to view single raw file and metadata
  • ewfmount – mount E01 images/split images to view single rawfile and metadata
Partition Table Support
  • dos (DOS Partition Table)
  • mac (MAC Partition Map)
  • bsd (BSD Disk Label)
  • sun (Sun Volume Table of Contents (Solaris))
  • gpt (GUID Partition Table (EFI))
Software Includes:
  • log2timeline (Timeline Generation Tool)
  • Rekall Framework (Memory Analysis)
  • Volatility Framework (Memory Analysis)
  • Autopsy (GUI Front-End for Sleuthkit)
  • PyFLAG (GUI Log/Disk Examination)afflib
    • afflib-tools
  • libbde
  • libesedb
  • libevt
  • libevtx
  • libewf
    • libewf-tools
    • libewf-python
  • libfvde
  • libvshadow
  • log2timeline
  • Plaso
  • qemu
  • SleuthKit
  • 100s more tools -> See Detailed Package Listing

SIFT Workstation 3 How-Tos

  • SANS DFIR Posters and Cheat Sheets
  • SIFT Documentation Project
  • How To Mount a Disk Image In Read-Only Mode
  • How To Create a Filesystem and Registry Timeline
  • How To Create a Super Timeline
  • How to use the SIFT Workstation for Basic Memory Image Analysis

Report Bugs

As with any release, there will be bugs and requests, please report all issues and bugs to the following website and location.

https://github.com/sans-dfir/sift/issues

SIFT Recommendations

SIFT workstation is playing an important role for the Brazilian national prosecution office, especially due to Brazilian government budgetary constraints. Its forensic capabilities are bundled on a way that allows an investigation to be conducted much faster than it would take if not having the right programs grouped on such great Linux distribution. The new version, which will be bootable, will be even more helpful. I’d highly recommend SIFT for government agencies or other companies as a first alternative, for acquisition and analysis, from the pricey forensics software available on the market.

  • Marcelo Caiado, M.Sc., CISSP, GCFA, EnCE

What I like the best about SIFT is that my forensic analysis is not limited because of only being ableto run a forensic tool on a specific host operating system. With the SIFT VM Appliance, I can create snapshots to avoid cross-contamination of evidence from case to case, and easily manage system and AV updates to the host OS on my forensic workstation. Not to mention, being able to mount forensic images and share them as read-only with my host OS, where I can run other forensic tools to parse data, stream-lining the forensic examination process.

Digital Forensics Cheat Sheets Collection


DFIR “Memory Forensics” Poster – Analysts armed with memory analysis skills have a better chance to detect and stop a breach before you become the next news headline. This poster shows some of the structures analyzed during memory forensic investigations. Just as those practicing disk forensics benefit from an understanding of file systems, memory forensic practitioners also benefit from an understanding of OS internal structures.
Download Here


DFIR “Advanced Smartphone Forensics” Poster– Forensic investigations often rely on data extracted from smartphones and tablets. Smartphones are the most personal computing device associated to any user, and can therefore provide the most relevant data per gigabyte examined. Commercial tools often miss digital evidence on smartphones and associated applications, and improper handling can render the data useless. Use this poster as a cheat-sheet to help you remember how to handle smartphones, where to obtain actionable intelligence, and how to recover and analyze data on the latest smartphones and tablets.
Download Here


DFIR “Evidence of…” Poster– The “Evidence of…” categories were originally created by SANS Digital Forensics ad Incidence Response faculty for the SANS course FOR408 – Windows Forensics. The categories map a specific artifact to the analysis questions that it will help to answer. Use this poster as a cheat-sheet to help you remember where you can discover key items to an activity for Microsoft Windows systems for intrusions, intellectual property theft, or common cyber crimes.
Download Here


DFIR “Find Evil” Poster – In an intrusion case, spotting the difference between abnormal and normal is often the difference between success and failure. Your mission is to quickly identify suspicious artifacts in order to verify potential intrusions. Use the information below as a reference for locating anomalies that could reveal the actions of an attacker.
Download Here


DFIR SIFT 3.0 Cheat Sheets and Brochure – Inside our DFIR course catalog you will find two critical cheat sheets. SIFT 3.0 guide and the Memory Forensics cheat sheets.
Download Here


SIFT Cheat Sheet – Looking to use the SIFT workstation and need to know your way around the interface? No problem, this cheat sheet will give you the basic commands to get cracking open your case using the latest cutting edge forensic tools.
Download Here


Evidence Collection Cheat Sheet – This sheet covers the various locations where evidence to assist in an investigation may be located.
Download Here


Linux Shell Survival Guide – This guide is a supplement to SANS FOR572: Advanced Network Forensics and Analysis. It covers some of what we consider the more useful Linux shell primitives and core utilities. These can be exceedingly helpful when automating analysis processes, generating output that can be copied and pasted into a report or spreadsheet document, or supporting quick-turn responses when a full tool kit is not available.
Download Here


Windows to Unix Cheat Sheet – It helps to know how to translate between windows and unix. This handy reference guide ties together many well known Unix commands with their Windows command line siblings. A great way to get Windows users familiar with the command line quickly.
Download Here


Log2timeline Cheat Sheet – Creating a timeline is easy with the essential reference guide. The step by step nature of the log2timeline cheat sheet will enable anyone not familiar with the process to step through creation of their first timeline in no time.
Download Here


Memory Forensics Cheat Sheet – Covering the popular memory suite Volatility, this cheat sheet will empower each investigator the key knowledge to quickly step through the 6 step memory analysis process using key commands from the plugins. This reference guide is very useful to have near you for those just starting out in memory forensics or those who are experts who need to quickly remember plugin syntax.
Download Here


Hex and Regex Forensics Cheat Sheet – Quickly become a master of sorting through massive amounts of data quickly using this useful guide to knowing how to use simple Regex capabilities built into the SIFT workstation.
Download Here


Developing Process for Mobile Device Forensics (Det. Cynthia A. Murphy)- With the growing demand for examination of cellular phones and other mobile devices, a need has also developed for the development of process guidelines for the examination of these devices. While the specific details of the examination of each device may differ, the adoption of consistent examination processes will assist the examiner in ensuring that the evidence extracted from each phone is well documented and that the results are repeatable and defensible.
Download Here


SANS FOR518 Reference Sheet – This cheat sheet is used to describe the core functions and details of the HFS+ Filesystem.
Download Here

Digital Forensic Trainings


Hash VerificationStart!
Intro to Files, Filesystems, and DisksStart!
Password CrackingStart!
PDF ForensicsStart!
Reddit Analysis ToolStart!
Basic Analysis of Web Browsing ActivityStart!
Malicious Website AnalysisStart!
Data Acquisition with ddStart!
Building a VM from a dd imageStart!
BEViewer 1.3Start!
Bulk Extractor v1.2Start!
Disk Forensics ConceptsStart!
Disk ScannerStart!
File Carving with ForemostStart!
File Carving with Magic NumbersStart!
Image RipperStart!
Pattern Matching with grepStart!
Raw Disk Image to Virtual MachineStart!
ScalpelStart!
ExtundeleteStart!
File Filtering Using HashsetsStart!
File Signature AnalysisStart!
md5deep & hashdeepStart!
NTFS Compression & File Recovery/CarvingStart!
OS Forensics ToolsStart!
TSK & AutopsyStart!
Malware SSL using BurpStart!
Android SDK ManagerStart!
Introduction & Installation of SantokuStart!
tcpdump 4.3.0Start!
Computer Networking & ProtocolsStart!
Intro to Network ForensicsStart!
Intro to VOIP ExtractionStart!
Intro to WiresharkStart!
Network MinerStart!
chrootkitStart!
Intro to OS LayoutStart!
Intro to Windows ForensicsStart!
Linux Log AnalysisStart!
Windows Registry Part 1Start!
Windows Registry Part 2Start!
Windows Registry Part 3Start!
Memory Analysis with VolatilityStart!
Steganography/SteganalysisStart!
NIST Hacking CaseStart!

Code

Documentation

from: http://cyfor.isis.poly.edu/43-spring_2013_digital_forensics_final_project_page.html


Code

Documentation

from: http://cyfor.isis.poly.edu/57-fall_2013_digital_forensics_final_project_page.html


Code

Documentation

from: http://cyfor.isis.poly.edu/60-spring_2014_digital_forensics_final_project_page.html


Code

Documentation

from: http://cyfor.isis.poly.edu/61-summer_2014_digital_forensics_final_project_page.html


Code

Documentation

from: http://cyfor.isis.poly.edu/62-fall_2014_digital_forensics_final_project_page.html


The CSAW High School Forensic Challenge is a rigorous test of cyber forensic knowledge.  This area of the CyFor site is dedicated to previous years’ challenges.  Where possible, we make evidence available for download, as well as the solutions.

Mini Challenges

Mini-Challenge 1

Mini-Challenge 2

Mini-Challenge 3

Mini-Challenge 4

Mini-Challenge 5

Mini-Challenge 6

Mini-Challenge 7

Past CSAW Challenges

HSF 2011 Finals

HSF 2011 Preliminary

HSF 2012 Finals

HSF 2012 Preliminary

HSF 2013 Finals

HSF 2013 Preliminary

from: http://cyfor.isis.poly.edu/7-challenges.html

PhEmail – a python open source phishing email tool that automates the process of sending phishing emails as part of a social engineering test


PhEmail

PhEmail is a python open source phishing email tool that automates the process of sending phishing emails as part of a social engineering test. The main purpose of PhEmail is to send a bunch of phishing emails and prove who clicked on them without attempting to exploit the web browser or email client but collecting as much information as possible. PhEmail comes with an engine to garther email addresses through LinkedIN, useful during the information gathering phase. Also, this tool supports Gmail authentication which is a valid option in case the target domain has blacklisted the source email or IP address. Finally, this tool can be used to clone corporate login portals in order to steal login credentials.

PhEmail phishing-testing

In recent years networks have become more secure through server hardening and deployment of security devices such as firewalls and intrusion prevention systems. This has made it harder for hackers and cyber criminals to launch successful direct attacks from outside of the network perimeter. As a result, hackers and cyber criminals are increasingly resorting to indirect attacks through social engineering and phishing emails.

What are social engineering and phishing attacks?

Social engineering is the art of tricking people into performing actions or revealing information with the aim of gaining access to information systems or confidential information. There are several social engineering attacks and techniques such as phishing emails, pretexting and tailgating.

Phishing is one of the easiest and most widely used social engineering attacks, where the attackers send spoofed emails that appear to be from a trusted individual or company such as a colleague or a supplier. The emails will often look identical to legitimate emails and will include company logos and email signatures. Once attackers successfully trick the victim into clicking on a malicious link or opening a booby-trapped document, they can bypass the company’s external defence mechanisms and gain a foothold in the internal network. This could allow them to gain access to sensitive and confidential information which might have financial or reputational consequences.

Installation

You can download the latest version of PhEmail by cloning the GitHub repository:

git clone https://github.com/Dionach/PhEmail

Usage

PHishing EMAIL tool v0.13
Usage: phemail.py [-e <emails>] [-m <mail_server>] [-f <from_address>] [-r <replay_address>] [-s <subject>] [-b <body>]
          -e    emails: File containing list of emails (Default: emails.txt)
          -f    from_address: Source email address displayed in FROM field of the email (Default: Name Surname <name_surname@example.com>)
          -r    reply_address: Actual email address used to send the emails in case that people reply to the email (Default: Name Surname <name_surname@example.com>)
          -s    subject: Subject of the email (Default: Newsletter)
          -b    body: Body of the email (Default: body.txt)
          -p    pages: Specifies number of results pages searched (Default: 10 pages)
          -v    verbose: Verbose Mode (Default: false)
          -l    layout: Send email with no embedded pictures 
          -B    BeEF: Add the hook for BeEF
          -m    mail_server: SMTP mail server to connect to
          -g    Google: Use a google account username:password
          -t    Time delay: Add deleay between each email (Default: 3 sec)
          -R    Bunch of emails per time (Default: 10 emails)
          -L    webserverLog: Customise the name of the webserver log file (Default: Date time in format "%d_%m_%Y_%H_%M")
          -S    Search: query on Google
          -d    domain: of email addresses
          -n    number: of emails per connection (Default: 10 emails)
          -c    clone: Clone a web page
          -w    website: where the phishing email link points to
          -o    save output in a file
          -F    Format (Default: 0): 
                0- firstname surname
                1- firstname.surname@example.com
                2- firstnamesurname@example.com
                3- f.surname@example.com
                4- firstname.s@example.com
                5- surname.firstname@example.com
                6- s.firstname@example.com
                7- surname.f@example.com
                8- surnamefirstname@example.com
                9- firstname_surname@example.com 

Examples: phemail.py -e emails.txt -f "Name Surname <name_surname@example.com>" -r "Name Surname <name_surname@example.com>" -s "Subject" -b body.txt
          phemail.py -S example -d example.com -F 1 -p 12
          phemail.py -c https://example.com

Usage of PhEmail for attacking targets without prior mutual consent is illegal

What can you do to protect yourself?

These attacks rely on and exploit weaknesses in human nature. Companies can take several steps to protect themselves and reduce the likelihood of such attacks being successful. The first step is to build a good security training and awareness program in which staff members are taught the dangers of phishing emails and how to identify such emails. The second step is to conduct regular client-side and social engineering tests which include sending targeted phishing emails. This would help the company evaluate the effectiveness of the security training and awareness program and how to improve it to try and eliminate the risk of such attacks.

More information can be found at: https://github.com/Dionach/PhEmail

GeoIP2 City Demo – A tool from maxmind.com


GeoIP2 City

ISP and Organization data is included with the purchase of the GeoIP2 ISP database or with the purchase of the GeoIP2 Precision City or Insights services.

Domain data is included with the purchase of the GeoIP2 Domain Name database or with the purchase of the GeoIP2 Precision City or Insights services.

If you’d like to test multiple IP addresses, we offer a demo for up to 25 addresses per day.

Try it out online at: https://www.maxmind.com/en/geoip-demo

EXIFdata.com – an online applicatation that lets you take a deeper look at your favorite images!


 What is EXIF data?

EXIF is short for Exchangeable Image File, a format that is a standard for storing interchange information in digital photography image files using JPEG compression. Almost all new digital cameras use the EXIF annotation, storing information on the image such as shutter speed, exposure compensation, F number, what metering system was used, if a flash was used, ISO number, date and time the image was taken, whitebalance, auxiliary lenses that were used and resolution. Some images may even store GPS information so you can easily see where the images were taken!

EXIFdata.com is an online applicatation that lets you take a deeper look at your favorite images!

Check it out yourself at: http://exifdata.com

Tineye – a reverse image search engine


TinEye

TinEye is a reverse image search engine. You can submit an image to TinEye to find out where it came from, how it is being used, if modified versions of the image exist, or to find higher resolution versions.

TinEye is the first image search engine on the web to use image identification technology rather than keywords, metadata or watermarks. It is free to use for non-commercial searching.

TinEye regularly crawls the web for new images, and we also accept contributions of complete online image collections. To date, TinEye has indexed 10,763,476,445 images from the web to help you find what you’re looking for. For more information, please see our FAQ, and for some actual TinEye search examples, check out our Cool Searches page.

Company Profile

TinEye is brought to you by the good folks at Idée Inc., an advanced image recognition and search software company. In addition to TinEye – the world’s first reverse image search engine – Idée develops several other image recognition based products and services used by the world’s leading imaging firms:

Adobe Agence France-Presse DiggAssociated Press Splash News & Picture AgencyKAYAK Masterfile
  • PixID – Editorial image monitoring for the news and entertainment photo industry. Clients include Associated Press, Agence France Press, Splash News
  • MulticolorEngine – Remarkable color search and analysis for your photographs and product images.
  • MatchEngine – Automated image matching and deduplication service. Clients include eBay, Kayak, Getty Images, Digg, iStockphoto, SmileTrain, Photoshelter.
  • MobileEngine – Mobile image recognition and identification. An automated high-sensitivity image matching solution for mobile platforms.
  • TinEye API – commercial TinEye searching using image identification.

Idée is an independent, privately held company headquartered in Toronto, Canada and we are hiring.

TinEye Contributors

GettyistockphotoWikimediaMasterfilePhotoshelterF1online

Our goal with TinEye is to connect images and information and to make sure that images can be attributed to their creator. If you are managing a large image collection, get in touch to have your image collection added to TinEye. This makes it easier for the original image authors to be found, and for image seekers to get the information they’re looking for. Contributors can submit a range of content from stock and editorial photographs to product images to illustrations and more. Learn more about how you can have TinEye index your image collection.

At TinEye, we want to help connect images to their creator. If you are interested in contributing your images to the TinEye index, create an imagemap and submit it to us. Once we index your images, TinEye users will be able to find the images on your website. Learn more about how to create and submit your TinEye imagemap.


Tineye can be found at: https://tineye.com

The Recon-ng Framework – A full-featured Web Reconnaissance framework written in Python.


The Recon-ng Framework

Featured | News | Credits | Usage Guide | Development Guide


Featured

Recon-ng is regarded as one of the top tools for open source reconnaisance and is featured in the following resources:

Training Courses

Books

  • “Advanced OSINT Target Profiling” by Shane MacDougall
  • Various titles available through Amazon.

News

Credits

A special thanks to my good friend Ethan Robish (@EthanRobish) who has been a technical advisor for this project since its inception. Without Ethan, Recon-ng simply would not be the tool that it is today. Thanks Ethan. For other credits, please see the various accepted pull requests and module meta data. Thank you to all who have contributed. Recon-ng is truly a community project.


Getting Started

Installation – Kali Linux

  • Install Recon-ng
    • apt-get update && apt-get install recon-ng

Installation – Source

  • Clone the Recon-ng repository.
    • git clone https://LaNMaSteR53@bitbucket.org/LaNMaSteR53/recon-ng.git
  • Change into the Recon-ng directory.
    • cd recon-ng
  • Install dependencies.
    • pip install -r REQUIREMENTS
  • Launch Recon-ng.
    • ./recon-ng
  • Use the “-h” switch for information on runtime options.
    • ./recon-ng -h

Dependencies

  • There is no guarantee that the included 3rd party libraries will work on all systems and architectures. If load errors are encountered, try downloading, compiling, and replacing the library which is raising exceptions.

Usage Notes

Below are a few helpful nuggets for getting started with the Recon-ng framework. While not all features are covered, the following notes will help make sense of a few of the frameworks more helpful and complex features.

  • Users will likely create and share custom modules that are not merged into the master branch of the framework. In order to allow for the use of these modules without interfering with installed package, the framework allows for the use of a custom module tree placed in the user’s “home” directory. In order to leverage this feature, a directory named “modules” must be created underneath the “.recon-ng” directory, i.e. “~/.recon-ng/modules/”. Custom modules that are added to the “~/.recon-ng/modules/” directory are loaded into the framework at runtime. Where the modules are placed underneath the “~/.recon-ng/modules/” directory doesn’t effect functionality, but things will look much nicer in the framework if the proper module directory tree is replicated and the modules are placed in the proper category.
  • Modules are organized to facilitate the flow of a penetration test, and there are separate module branches within the module tree for each methodology step. Reconnaissance, Discovery, Exploitation and Reporting are steps 1, 3, 4 and 5 of the Web Application Penetration Testing Methodology. Therefore, each of these steps has their own branch in the module tree. It is important to understand the difference between Reconnaissance and Discovery. Reconnaissance is the use of open sources to gain information about a target, commonly referred to as “passive reconnaissance”. Discovery, commonly referred to as “active reconnaissance”, occurs when packets are explicitly sent to the target network in an attempt to “discover” vulnerabilities. While Recon-ng is a reconnaissance framework, elements from the other steps of the methodology will be included as a convenient place to leverage the power of Python.
  • After loading a module, the context of the framework changes, and a new set of commands and options are available. These commands and options are unique to the module. Use the “help” and “show” commands to gain familiarity with the framework and available commands and options at the root (global) and module contexts.
  • The “info” and “source” subcommands of “show” (available only in the module context) are particularly helpful ways to discover the capabilities of the framework. The “show info” command will return detailed information about the loaded module, and the “show source” command will display its source code. Spend some time exploring modules with the “show info” and “show source” commands to get a sense for how information flows through the framework.
  • The “query” command assists in managing and understanding the data stored in the database. Users are expected to know and understand Structured Query Language (SQL) in order to interact with the database via the “query” command. The “show schema” command provides a graphical representation of the database schema to assist in building SQL queries. The “show schema” command creates the graphical representation dynamically, so as the schema of the database changes, so will the result of the command.
  • Pay attention to the global options. Global options are the options that are available at the root (global) context of the framework. Global options have a global effect on how the framework operates. Global options such as “VERBOSE” and “PROXY” drastically change how the modules present feedback and make web requests. Explore and understand the global options before diving into the modules.
  • The modular nature of the framework requires frequently switching between modules and setting options unique to each one. It can become taxing having to repeatedly set module options as information flows through the framework. Therefore, option values for all contexts within the framework are stored locally and loaded dynamically each time the context is loaded. This provides persistence to the configration of the framework between sessions.
  • Workspaces help users to conduct multiple simultaneous engagements without having to repeatedly configure global options or databases. All of the information for each workspace is stored in its own directory underneath the “~/.recon-ng/workspaces/” folder. Each workspace consists of it’s own instance of the Recon-ng database, a configuration file for the storage of configuration options, reports from reporting modules, and any loot that is gathered from other modules. To create a new workspace, use the “workspaces” command, workspaces add <name>. Loading an existing workspace is just as easy, workspaces select <name>. To view a list of available workspaces, see the “workspaces list” command or the “show workspaces” alias. To delete a workspace, use the “workspaces delete” command, workspaces delete <name>. Workspaces can also be created or loaded at runtime by invoking the “-w <workspace>” argument when executing Recon-ng, ./recon-ng -w bhis.
  • The “search” command provides the capability to search the names of all loaded modules and present the matches to the user. The “search” command can be very helpful in determining what do do next with the information that has been harvested, or identifying what is required to get the desired information. The “recon” branch of the module tree follows the following path structure:recon/<input table>-<output table>/<module>. This provides simplicity in determining what module is available for the action the user wants to take next. To see all of the modules which accept a domain as input, search for the input table name “domains” followed by a dash: search domains-. To see all of the modules which result in harvested hosts, search for the output table name “hosts” with a preceding dash: search -hosts.
  • The entire framework is equipped with command completion. Whether exploring standard commands, or passing parameters to commands, tap the “tab” key several times to be presented with all of the available options for that command or parameter.
  • Even with command completion, module loading can be cumbersome because of the directory structure of the module tree. To make module loading easier, the framework is equipped with a smart loading feature. This feature allows modules to be loaded by referring to a keyword unique to the desired module’s name. For instance, use namechk will load the “recon/contacts-contacts/namechk” module without requiring the full path since it is the only module containing the string “namechk”. Attempting to smart load with a string that exists in more than one module name will result in a list of all possible modules for the given keyword. For example, there are many modules whose names contain the string “pwned”. Therefore, the command use pwned would not load a module, but return a list of possible modules for the user to reference by full module name.
  • Every piece of information stored in the Recon-ng database is a potential input “seed” from which new information can be harvested. The “add” command allows users to add initial records to the database which will become input for modules. Modules take the seed data, transform it into other data types, and store the data in the database as potential input for other modules. Each module has a “SOURCE” option which determines the seed data. The “SOURCE” option provides flexibiliy in what the user can provide to modules as input. The “SOURCE” option allows users to select “default”, which is seed data from the database as determined by the module developer, a single entry as a string, the path to a file, or a custom SQL query. The framework will detect the source and provide it as input to the module. Changing the “SOURCE” option of a module does not effect how the module handles the resulting information.
  • While the “shell” command and “!” alias give users the ability to run system commands on the local machine from within the framework, neither of these commands is necessary to achieve this functionality. Any input that the framework does not understand as a framework command is executed as a system command. Therefore, the only time that “shell” or “!” is necessary is when the desired command shares the same name as a framework command.
  • A recorded session of all activity is essential for many penetration testers, but builtin OS tools like “tee” and “script” break needed functionality, like tab completion, and muck with output formatting. To solve this dilema, the framework is equipped with the ability to spool all activity to a file for safe keeping. The “spool” command gives users the ability to start and stop spooling, or check the current spooling status. The destination file for the spooled data is set as a parameter of the “spool start” command, spool start <filename>. Use help spool for more information on the “spool” command.
  • Developers have the ability to create new tables and columns in the database dynamically as information is harvested from various resources. Users should pay attention to local variables and run the “show schema” command often to check for new data being stored in the database. Any new table that is created will automatically be added to the list of “show” commands for quick access to the information.

Acquiring API Keys

  • Bing API Key (bing_api) – Sign up for the free subscription to the Bing Search API here. Sign in to the Windows Azure Marketplace and go to the “My Account” tab. The API key will be available under the “Account Keys” page.
  • BuiltWith API Key (builtwith_api) – Sign up for a free account here. Sign in to the application. The API key will be available in the upper right hand portion of the screen.
  • Facebook API Key (facebook_api) – TBD
  • Facebook Secret (facebook_secret) – TBD
  • Flickr API Key (flickr_api) – TBD
  • Google API Key (google_api) – Create an API Project here. The API key will be available in the project management console.
  • Google Custom Search Engine (CSE) ID (google_cse) – Create a CSE here. The CSE ID will be available in the CSE management console. Read here for guidance on configuring the CSE to search the entire web. Otherwise, the CSE will be restricted to only searching domains specified within the CSE management console. This will drastically effect the results of any module which leverages the CSE.
  • Instagram API Key (instagram_api) – Log in to http://instagram.com/developer/clients/register/ with an existing Instagram account and register a new application. Add http://localhost:31337 as the “OAuth redirect_uri”. Click “Manage Clients” at the top of the screen and the API key will be available as the “CLIENT ID”.
  • Instagram Secret (instagram_secret) – Log in to http://instagram.com/developer/. Click “Manage Clients” at the top of the screen and the Secret key will be available as the “CLIENT SECRET”.
  • IPInfoDB API Key (ipinfodb_api) – Create a free account here. Log in to the application here. The API key will be available on the “Account” tab.
  • Jigsaw API Key (jigsaw_api) – Create an account and sign up for the $1,500/year plan here. A corporate email address is preferred. Submit a request for an API token here using the same email address that was used to create the paid account. The Jigsaw API team will look up the account to validate that it is a paid membership and issue an API token.
  • LinkedIn API Key (linkedin_api) – Log in to the developer portal with an existing LinkedIn account and add a new application. Click on the application name. Add http://localhost:31337 to the list of “OAuth 2.0 Redirect URLs”. The API key will be available underneath the “OAuth Keys” heading.
    • As of November 4th, 2013, the People Search API (required for all LinkedIn related modules) has been added to the Vetted API Access program. As a result, a Vetted API Access request must be submitted and approved for the application in order for the associated API key to function properly with the LinkedIn modules.
  • LinkedIn Secret (linkedin_secret) – The Secret key will be available underneath the “OAuth Keys” heading for the application created above.
  • PwnedList API Key (pwnedlist_api) – Contact PwnedList directly regarding API access.
  • PwnedList Initialization Vector (pwnedlist_iv) – Contact PwnedList directly regarding API access.
  • PwnedList Secret (pwnedlist_secret) – Contact PwnedList directly regarding API access.
  • Shodan API Key (shodan_api) – Create an account or sign in to Shodan using one of the many options available here. The API key will be available on the right side of the screen. An upgraded account is required to access advanced search features.
  • Twitter Consumer Key (twitter_api) – Create an application here. The Consumer key will be available on the application management page.
  • Twitter Consumer Secret (twitter_secret) – The Consumer secret will be available on the application management page for the application created above.
  • VirusTotal API Key (virustotal_api) – Create a free account by clicking the “Join our community” button here. Log in to the application and select “My API key” from the user menu. The API key will be visible towards the top of the page.

Scripting the Framework

  • The entire framework is scriptable through the use of a resource file. A resource file is a plain text file containing a list of commands for the framework. By referencing the resource file when executing Recon-ng, ./recon-ng -r <filename>, the framework will read in the list of commands from the file and feed them to the command interpreter, in sequence. The resource file does not have to end by exiting the framework. The framework will automatically detect the end of the resource file and hand stdin back over to the terminal session for user input. The script is complete when the framework prompt looks like this: recon-ng > EOF.
  • To make it easy to create resource files, the framework is equipped with the ability to record commands. The “record” command gives users the ability to start and stop command recording, or check the current recording status. The destination file for the recorded commands is set as a parameter of the “record start” command, record start <filename>. Use help record for more information on the “record” command.
  • If external shell scripting is preferred, the framework includes a tool called ./recon-cli.py which makes all of the functionality of the Recon-ng framework accessible from the command line. Use ./recon-cli.py -h for information on runtime options.

Analytics

The Recon-ng project consists of a one-man development team in terms of sustaining the framework. When things break, as they often do when dealing with evolving web technologies, users don’t got to the module developer, they go to the Recon-ng Issue Tracker or directly to me. As the framework grows, module issues become more and more frequent. I needed a way to “trim the fat” in the framework and determine the best approach to maintaining broken modules. Therefore, I decided to add an analytics element (eab6307) which would allow me to track the most commonly used modules. That way, when a user comes to me and says, “There is a problem with module X.” I can look at my analytics and determine whether or not it is worth the effort to fix myself, ask them to fix, or remove from the framework all together.

Initially, I had a few folks notice and complain, citing issues with custom modules being reported and not having the ability to disable the system completely. Both of these items have been addressed (717c7c6). Overall, it is a system that helps me more efficiently maintain the framework. The only thing attributable to the user is their IP address. To me, this is a non-issue. People use the Internet everyday to visit web pages and logically attribute themselves to shady places. There is no such thing as “leaking” an external IP address. It is a part of layer 3 communication and the way the Internet works. If you don’t want your IP leaked, don’t use the Internet, or use an anonymizing service. There is no targeting or harvested information included in the analytics. I encourage users to watch the traffic and validate for themselves.

The first time Recon-ng runs, it creates a file in the user’s home ~/.recon-ng directory called .cid. It is a randomly generated UUID that is non-specific to the system. That UUID is sent with each anaytics request to differentiate users, allowing me to track how many different users are using the module. There is a big difference between one person using a module 3,000 times in a day, and 3,000 users using a module once a day. I need to know this in order to make good maintenance decisions. Analytics requests are sent each time a module is loaded using the load or use command. The analytics request includes the UUID, the module name, and the version of Recon-ng. No analytics requests are made when loading custom modules (modules that reside in the users home ~/.recon-ng/modules/ directory), and the entire system can be disabled by running Recon-ng with the --no-analytics flag. See the ./recon-ng -h help menu for more information.

Additional Help

Recon-ng has an official IRC channel (#recon-ng) located on the Freenode network. For additional help, information, and general discussion about the framework, connect to Freenode and join the channel using the /join #recon-ng command.


More information can be found at: https://bitbucket.org/LaNMaSteR53/recon-ng

theHarvester – E-mail, subdomain and people names harvester


*******************************************************************
*                                                                 *
* | |_| |__   ___    /\  /\__ _ _ ____   _____  ___| |_ ___ _ __  *
* | __| '_ \ / _ \  / /_/ / _` | '__\ \ / / _ \/ __| __/ _ \ '__| *
* | |_| | | |  __/ / __  / (_| | |   \ V /  __/\__ \ ||  __/ |    *
*  \__|_| |_|\___| \/ /_/ \__,_|_|    \_/ \___||___/\__\___|_|    *
*                                                                 *
* TheHarvester Ver. 2.5                                           *
* Coded by Christian Martorella                                   *
* Edge-Security Research                                          *
* cmartorella@edge-security.com                                   *
*******************************************************************

What is this?
-------------

theHarvester is a tool for gathering e-mail accounts, subdomain names, virtual
hosts, open ports/ banners, and employee names from different public sources
(search engines, pgp key servers).

Is a really simple tool, but very effective for the early stages of a penetration
test or just to know the visibility of your company in the Internet.

The sources are:

Passive:
--------
-google: google search engine  - www.google.com

-googleCSE: google custom search engine

-google-profiles: google search engine, specific search for Google profiles

-bing: microsoft search engine  - www.bing.com

-bingapi: microsoft search engine, through the API (you need to add your Key in the discovery/bingsearch.py file)

-pgp: pgp key server - pgp.rediris.es

-linkedin: google search engine, specific search for Linkedin users


-vhost: Bing virtual hosts search

-twitter: twitter accounts related to an specific domain (uses google search)

-googleplus: users that works in target company (uses google search)


-shodan: Shodan Computer search engine, will search for ports and banner of the discovered hosts  (http://www.shodanhq.com/)


Active:
-------
-DNS brute force: this plugin will run a dictionary brute force enumeration
-DNS reverse lookup: reverse lookup of ip´s discovered in order to find hostnames
-DNS TDL expansion: TLD dictionary brute force enumeration


Modules that need API keys to work:
----------------------------------
-googleCSE: You need to create a Google Custom Search engine(CSE), and add your
 Google API key and CSE ID in the plugin (discovery/googleCSE.py)
-shodan: You need to provide your API key in discovery/shodansearch.py


Dependencies:
------------
-Requests library (http://docs.python-requests.org/en/latest/)

Changelog in 2.5:
-----------------
-Replaced httplib by Requests http library (for Google related)
-Fixed Google searches


Comments? Bugs? requests?
------------------------
cmartorella@edge-security.com

Updates:
--------
https://github.com/laramies/theHarvester

Thanks:
-------
John Matherly -  SHODAN project
Lee Baird for suggestions and bugs reporting